
Key Points:
- Affordability depends heavily on location. Regional differences in prices, taxes, and utility costs lead to wide disparities in how much of one’s income is spent on housing.
- High home prices—particularly in Western markets—drive up mortgage and tax costs, leading to some of the highest cost burden rates in the country.
- High income levels don’t always ease the strain. In cities like San Francisco and New York, elevated earnings often coexist with high cost-burden rates due to outsized housing costs.
Our cost-of-living series has analyzed how rising costs are reshaping the financial reality of homeownership. We began by examining the surge in homeowners insurance premiums, driven by severe weather and higher construction costs. Next, we explored how across-the-board increases in housing costs—from mortgages to maintenance—are squeezing budgets for those with mortgages and even those that outright own their homes. In our third installment, we highlighted how the financial burden is falling hardest on younger households and older adults.
In our final chapter, we explore the role of geography in housing affordability, examining how the share of cost-burdened households differ across the country—and why the forces fueling the increasing costs go well beyond climate risk. Our analysis shows that affordability challenges vary sharply across regions, with the greatest strain in markets where structural factors, like limited housing supply, demographic shifts, and income dynamics, drive monthly costs higher and push more households past the cost-burdened threshold.
“Local dynamics—home prices, property taxes, insurance costs, and supply—will shape the pace of the reset, even as broader economic forces like interest rates and income growth provide the backdrop.””
Mapping the Rise of the Cost Burdened
Housing affordability is shaped by a complex mix of regional market dynamics, macroeconomic conditions, and environmental risks. Mortgage principal and interest make up the largest share of monthly ownership costs—about 56 percent in 2023—followed by utilities (22 percent), property taxes (18 percent), and property insurance (8 percent). These expenses vary widely by location, shaped by differences in housing market dynamics, tax and utility structures, and local economic conditions, as well as broader macroeconomic and labor market conditions.
Affordability isn’t just about the size of those bills—it’s about how much of a household’s income they consume. To understand that burden, we compared total monthly ownership expenses—including mortgage payments, property taxes, utilities, and insurance—with the share of households considered cost burdened, which we defined as those spending 30 percent or more of their income on housing. The interactive scatterplot below shows this relationship for the 50 largest housing markets1. Monthly costs run along the horizontal axis, cost-burden rates are depicted on the vertical axis. Bubble size reflects median household income, and color indicates region.
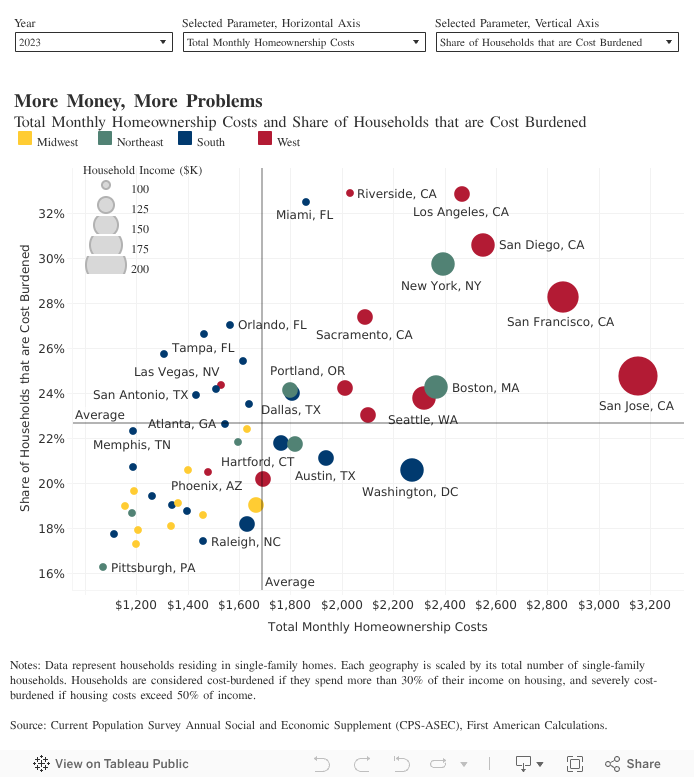
The scatterplot illustrates how higher total ownership costs correlate with higher cost burden rates. The top-right quadrant of this chart highlights markets where homeowners face the greatest pressures—places where both monthly costs and cost-burden rates are high. West Coast cities are heavily represented here, with California alone accounting for six of the 14 markets in this group. Homeowners in Los Angeles and Riverside, Calif. face the heaviest cost burdens, while those in San Francisco and San Jose, Calif. contend with some of the highest monthly bills. Outside the West, this quadrant includes major housing markets in the Northeast, such as New York and Boston, as well as Southern cities, like Miami and Dallas.
What ties these cities together isn’t just high monthly bills, but high home prices. In these areas, elevated prices drive up mortgage payments and property taxes, pushing more households past the 30 percent cost-burden threshold. Incomes tend to be higher in these cities also, but that doesn’t always translate into relief. For many homeowners, even a large paycheck isn’t enough to keep pace with the cost of housing. In 2023, more than one in four households in the West spent at least 30 percent of their income on housing, compared with about one in five in the South, Northeast, and Midwest—even though households in those regions earn less on average.
The bottom-left quadrant of the scatterplot features cities where both monthly ownership costs and cost-burden rates are low. These markets are concentrated in the Midwest and parts of the South, where home prices remain relatively modest and housing costs take up a smaller share of household income. Cities like Pittsburgh, Birmingham, Ala., and Indianapolis stand out for their affordability, with some of the lowest ownership costs and cost burden rates. While no market is immune to rising costs, these areas continue to offer more financial breathing room for homeowners.
The other two quadrants tell a more nuanced story. The top-left quadrant captures markets like Orlando and Tampa with higher cost-burden rates, despite lower-than-average monthly costs. These are typically areas where incomes lag behind modest housing expenses, leaving a larger share of households stretched thin, despite relatively affordable home prices. Conversely, the bottom-right quadrant includes markets where monthly ownership costs are high, but cost-burden rates remain relatively low—often because household incomes are also elevated. Washington, D.C., is a prime example. While homeowners in the nation’s capital face higher-than-average monthly bills compared to most of the country, strong local income levels help keep the share of cost-burdened households in check.
Local Dynamics Will Shape the Next Housing Cycle
We’ve spent this series examining how rising costs—from insurance premiums to mortgage payments—have reshaped the affordability of homeownership. While 2023 data reflected mounting burdens, conditions have since stabilized. Price growth has slowed nationally, and prices have even declined in some markets, particularly those with strong construction, helping to ease cost burdens for new buyers and limiting further tax pressure for existing owners. Construction costs have normalized, reducing the risk of further insurance hikes tied to replacement costs, though pressures will likely persist in disaster-prone areas. With inventory rising and the potential for mortgage rates to soften modestly, there’s room for affordability improvements and price calibration. Together, these factors set the stage for the opening act of a new cycle—one defined not by a boom or a bust, but by a slow reset. Local dynamics—home prices, property taxes, insurance costs, and supply—will shape the pace of the reset, even as broader economic forces like interest rates and income growth provide the backdrop.
[1] Readers can toggle between survey year, monthly cost type (total, mortgage P&I, property insurance, property taxes, utilities), and degree of cost burden (30 percent or severe 50 percent).


