
Key Points:
- Increased residential construction activity, especially in the South, is improving affordability in certain markets.
- Housing supply has surged in the South, with over half of the 1.5 million building permits issued in 2024 located the region.
- Our analysis shows a strong correlation between new-home construction and home prices, with elevated construction activity leading to slower price appreciation or price declines.
Spring ushers in the start of the annual home-buying season, with more listings blooming in early spring than at any other time of year. During the spring and summer months, housing supply and demand both rise as buyers and sellers take advantage of favorable weather, school schedules, and holidays to make their moves.
As we approach the spring housing market of 2025, the question remains whether it will roar like a lion or pass meekly like a lamb? Housing supply shortages continue to pose a challenge nationwide, as many homeowners struggle to find a suitable upgrade from their current home, while first-time buyers face ongoing affordability constraints and limited inventory at the entry-level price tier. However, real estate is inherently local, and supply dynamics are no exception. Our analysis of recent regional construction trends suggests the degree to which the market is a lion or lamb will be influenced by recent homebuilding trends.
“Homebuilders have kept their hammers busy to help narrow the inventory gap especially in certain markets. Buyers in these markets will have more opportunities to find affordable options during the 2025 spring home-buying housing season.”
Raising Roofs to Improve Housing Affordability
In the housing market, you can't buy what's not for sale – and with existing-home sales hovering near their lowest level since the late 1990s, home buyers nationwide will likely continue to face limited availability this spring and summer. This lack of supply makes it harder for first-time homebuyers to jump into the market and also hurts existing homeowners looking to buy their next home. Additionally, with elevated mortgage rates and affordability challenges, many potential buyers won’t be able to afford a home even if they find one, keeping a lid on market normalization.
Homebuilders have kept their hammers busy to help narrow the inventory gap, especially in certain markets. Buyers in these markets will have more opportunities to find affordable options during the 2025 spring home-buying season. According to the U.S. Census Bureau, nearly 1.5 million building permits were issued for privately-owned housing units in 2024, including single-family homes and multi-unit properties like duplexes and triplexes. However, this building surge has not been evenly distributed across the country. Over half of the permits, 53 percent or 803,000 units, issued in 2024 were in the South, more than double the number issued in any other Census region.
The scatterplot below of the top 50 markets is divided into four quadrants, with the y-axis representing the number of housing permits (per 1,000 households) and the x-axis representing annual home sale price growth1. The chart suggests a strong correlation between the number of permits issued in a market and home prices—as the construction of new homes increases relative to the size of the housing market, there is more downward pressure on home prices. New residential construction enhances housing affordability by expanding the housing supply in local markets, increasing available inventory and slowing down the pace of house price appreciation, if not reversing it.
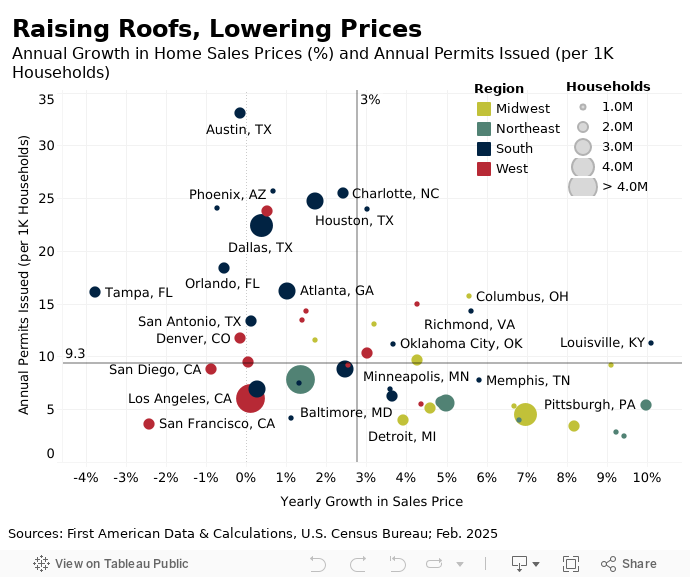
The quadrants are determined by the median values for each series across all markets. In 2024, half of the top 50 markets issued at least 9.3 new residential construction permits per 1,000 households (top two quadrants), and sales prices increased by no more than 2.8 percent from January 2024 to January 2025 (left two quadrants). Sixteen markets outperformed their peers in both construction activity and pricing (top left quadrant), with 10 of these markets located in the South Census region. For example, Tampa authorized approximately 16 new housing units per 1,000 households and home prices declined by 3.8 percent annually, the steepest drop in the U.S. By contrast, Pittsburgh issued approximately a third of that—5.4 units per 1,000 households—and home prices surged by 10.0 percent year over year.
Notably, 10 of the top 16 markets with the highest supply growth are located in the South, where the proportional increases relative to the size of the local housing market have been more significant. The surge in homebuilding in these markets is driven by supply-side factors, such as abundant land and favorable zoning regulations. Additionally, demand-side factors, like lower living costs and relatively more affordable housing options, will continue to attract new residents to these regions and further encourage additional construction—a virtuous cycle.
You Can’t Buy What’s Not for Sale, But You Can Build It
As we approach the 2025 home-buying season, increased residential construction activity offers a glimmer of hope for prospective buyers by boosting overall housing supply and, in turn, enhancing affordability. However, our analysis of recent regional construction trends reveals that this growth is not evenly distributed across the country but, where builders are raising roofs, they are also helping to slow or lower prices.
[1] Annual home prices are calculated at the CBSA level using the First American Data & Analytics (DNA) House Price Index.


