
Key Points:
- Mortgage rates are likely to hover in the low-6s, so affordability improves mostly because price growth cools while incomes rise.
- Inventory edges higher as the rate lock-in effect loosens, but the recovery is uneven by region.
- New homes keep an edge over the existing-home market as builders sell what’s already built with targeted incentives, while many owners remain rate-locked.
In our 2025 outlook, we predicted: “the 2025 housing market is poised to make strides forward – offering progress, but still far from perfection.” This forecast proved accurate. In 2025, mortgage rates eased, inventory climbed, affordability improved, and purchase applications exceeded year-ago levels. Nevertheless, the market remains far from ‘normal.’ Existing-home sales so far have averaged about 4 million annualized, while affordability constraints and the rate lock-in effect have continued to cap market potential.
There are no quick fixes—recoveries take time. The trends of 2025 will continue into 2026 as the market slowly marches toward normal—progress without a breakout. What does that look like in practice? Six dynamics will shape the year—affordability, life-driven demand, regional gaps, stress pockets, rising supply, and the new-home edge.
“The housing market won’t return to normal in 2026, but it should bring further progress as life events pull more buyers and sellers into action.”
Prediction 1: Affordability will steadily improve, mostly via prices and paychecks
The 2026 outlook hinges on inflation, the labor market, and Federal Reserve policy. The Fed resumed cutting rates in 2025, but sticky inflation, tariff-related pressures, and fiscal dynamics could limit how far the cycle runs. Our base case is mortgage rates holding in the low 6 percent range, but we could see movements lower from today’s levels toward six. That would be helpful, but it would not be enough to jumpstart the market on its own.
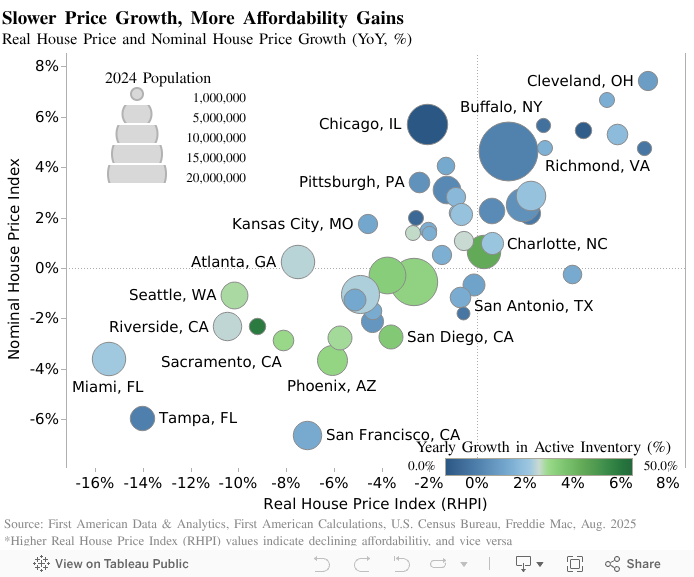
The heavy lifting comes from moderate home-price growth as inventory improves, paired with continued income gains. Through most of 2025, affordability improved year over year, in part because income growth outpaced nominal house-price gains. Currently, our First American Data & Analytics house price index shows appreciation at its slowest pace since 2012. If that pattern continues into 2026, affordability should keep inching higher, particularly in markets with more active inventory where sellers are trimming prices to bring buyers off the sidelines.
Prediction 2: Demographics and ‘life happens’ will lift sales activity
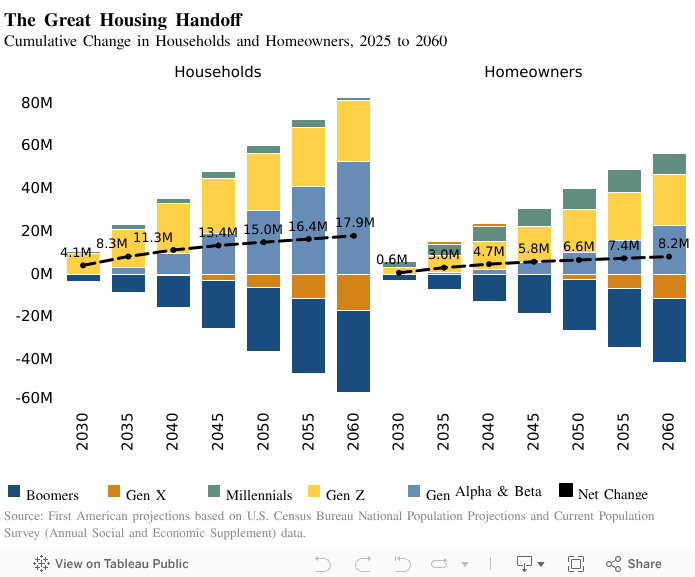
There is still significant pent-up demand among first-time and repeat buyers. The pre-pandemic five-year average for existing-home sales was 5.4 million (SAAR). Averaging 2022 through 2025 leaves us roughly 4 million sales short of that benchmark, which is a lot of missing buyers and sellers. Demographics add fuel. Nearly 47 million Americans are in their thirties, and many still rent. That underscores how large the pool of potential first-time buyers is as life stages line up with housing needs. Our recent work points to a long runway. Millennials alone will add roughly 10.6 million owner households over the next 25 years as their ownership rate climbs over time, with Gen Z following behind. Even if mortgage rates stay in the low-6 percent range, weddings and separations, growing families, job moves, caregiving, and downsizing will continue to drive sales activity. Transactions grind higher as 2026 unfolds because life, and life events, keep happening.
Prediction 3: Regional variations will persist
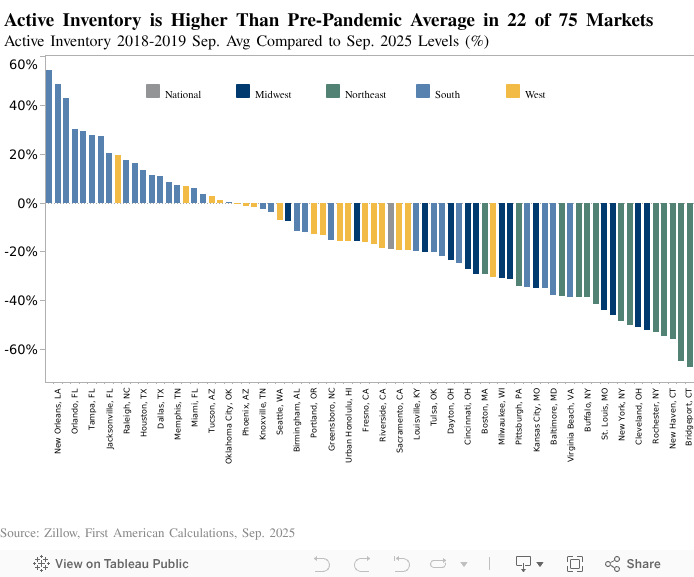
Supply conditions still differ by region. The Midwest and Northeast tend to be scarcest on both resale and new-home inventory, which supports quicker time to contract and fewer concessions heading into 2026. Many Southern and Western metros have added more supply. In September, 22 of the top 75 markets had higher active inventory than their September average in 2018 to 2019, and all 22 were in the South or West, with half in Florida or Texas. Places like Austin, Texas, and Tampa, Florida, saw outsized price gains during the boom, then faced slower in-migration and higher rates, which made prices feel stretched relative to local incomes. Abundant new-home supply amplified the adjustment in some markets by giving buyers more choice. Looking ahead, expect a two-speed market. Lean inventory in the Northeast and Midwest keeps conditions relatively tight and price growth steadier, while parts of the South and West remain soft. Lower mortgage rates or stronger local job growth could firm up those supply-rich markets later in the year, while rising insurance and other carrying costs, especially along the coast, could widen the gap.
Prediction 4: Pockets of weakness, but no wave of distress
Measures of distress have risen from the pandemic floor, yet the national picture still looks like normalization, rather than crisis. The softer spots tend to be where affordability is most stretched, insurance costs have jumped, or local job growth has cooled, and among borrowers with thinner cushions, such as some FHA borrowers. A true foreclosure wave usually needs two triggers at once: loss of income and a lack of equity. The labor market has cooled but not cracked, and homeowners still hold a very large equity cushion, so the risk remains contained. In 2026, the strain should be localized. Prices are slumping in some Sun Belt and Western metros that surged during the boom, and recent buyers with small down payments are more exposed if prices slip. We will watch the labor market closely, but the base case is gradual normalization, rather than a broad wave.

Prediction 5: Inventory will steadily rise as lock-in loosens
Supply improved in 2025 as more owners made peace with ‘higher for longer.’ By our ‘inventory turnover’ gauge—the share of existing homes for sale relative to households—the long-run average is about 2.5 percent, or roughly 250 homes per 10,000 households. We began 2025 near 1.4 percent, but almost touched 1.5 percent as the year progressed. That remains well below normal, but it is progress. The gains were not uniform. Inventory increased more in the Sun Belt, especially in Florida and Texas, where more new construction and a slower market added supply. National active listings remain higher than a year ago, though the pace of growth has cooled a bit as some owners in softer markets tested the waters and then delisted. Looking to 2026, the direction is still up, even if the climb is steady, rather than steep. Life events nudge more owners to move, the lock on all those existing homeowners with sub-4 percent mortgages loosens at the margins, and completions add more options for buyers. If mortgage rates edge lower, that helps at the margin as well.

Prediction 6: New homes keep the edge—sell what is built, then set the pace
Single-family construction is trending lower as builders balance elevated inventories against softer demand. Affordability challenges and a pickup in resale supply are pulling buyers away from brand-new homes, and permit trends point to builder caution until visibility improves. On the sales side, new-home sales have run below single-family production, which keeps the inventory-to-sales ratio high and pushes builders to focus on turning standing inventory. Incentives, especially rate buydowns, have attracted buyers, but have also squeezed margins, which reinforces a ‘sell what is built first’ approach. New construction also leans on the move-up buyer, and those buyers want confidence that their current home will sell at an acceptable price before they commit. Lower mortgage rates would help, but what really moves builders is sustained demand. Many existing owners remain rate-locked, which limits resale choices and keeps attention on new homes where product is available and sellers are flexible. That is why new-home sales are likely to hold an edge over the existing market in 2026. Builders can adjust quickly with targeted buydowns, closing-cost help, or price trims.

Progress without a breakout
The housing market enters 2026 on steadier footing. We expect affordability to improve mainly because prices are cooling and paychecks are rising, rather than because financing suddenly gets cheap. Demand is powered by milestones rather than spreadsheets. Regional differences persist as leaner Northern and Midwestern markets and supply-rich Southern and Western markets follow different tempos. We see pockets of stress, rather than a foreclosure wave, and supply continues to swell as the rate lock-in effect slowly loosens. New construction steadies early in the year and retains a relative edge while conditions firm. The housing market won’t return to normal in 2026, but it should bring further progress as life events pull more buyers and sellers into action.


