In February 2019, the housing market continued to underperform its potential, but showed signs of promise leading into the spring home-buying season. Actual existing-home sales are 2.5 percent below the market’s potential, according to our Potential Home Sales model. That means the market has the potential to support 127,000 more home sales at a seasonally adjusted annualized rate (SAAR). Supply shortages have been the primary culprit for this performance gap – you can’t buy what’s not for sale. However, so far in 2019, we’ve seen mortgage rates decline and wages rise – both trends work to boost house-buying power and fuel greater market potential for home sales, setting the stage for a stronger than expected spring home-buying season.
“So far in 2019, we’ve seen mortgage rates decline and wages rise – both trends work to boost house-buying power and fuel greater market potential for home sales, setting the stage for a stronger than expected spring home-buying season.”
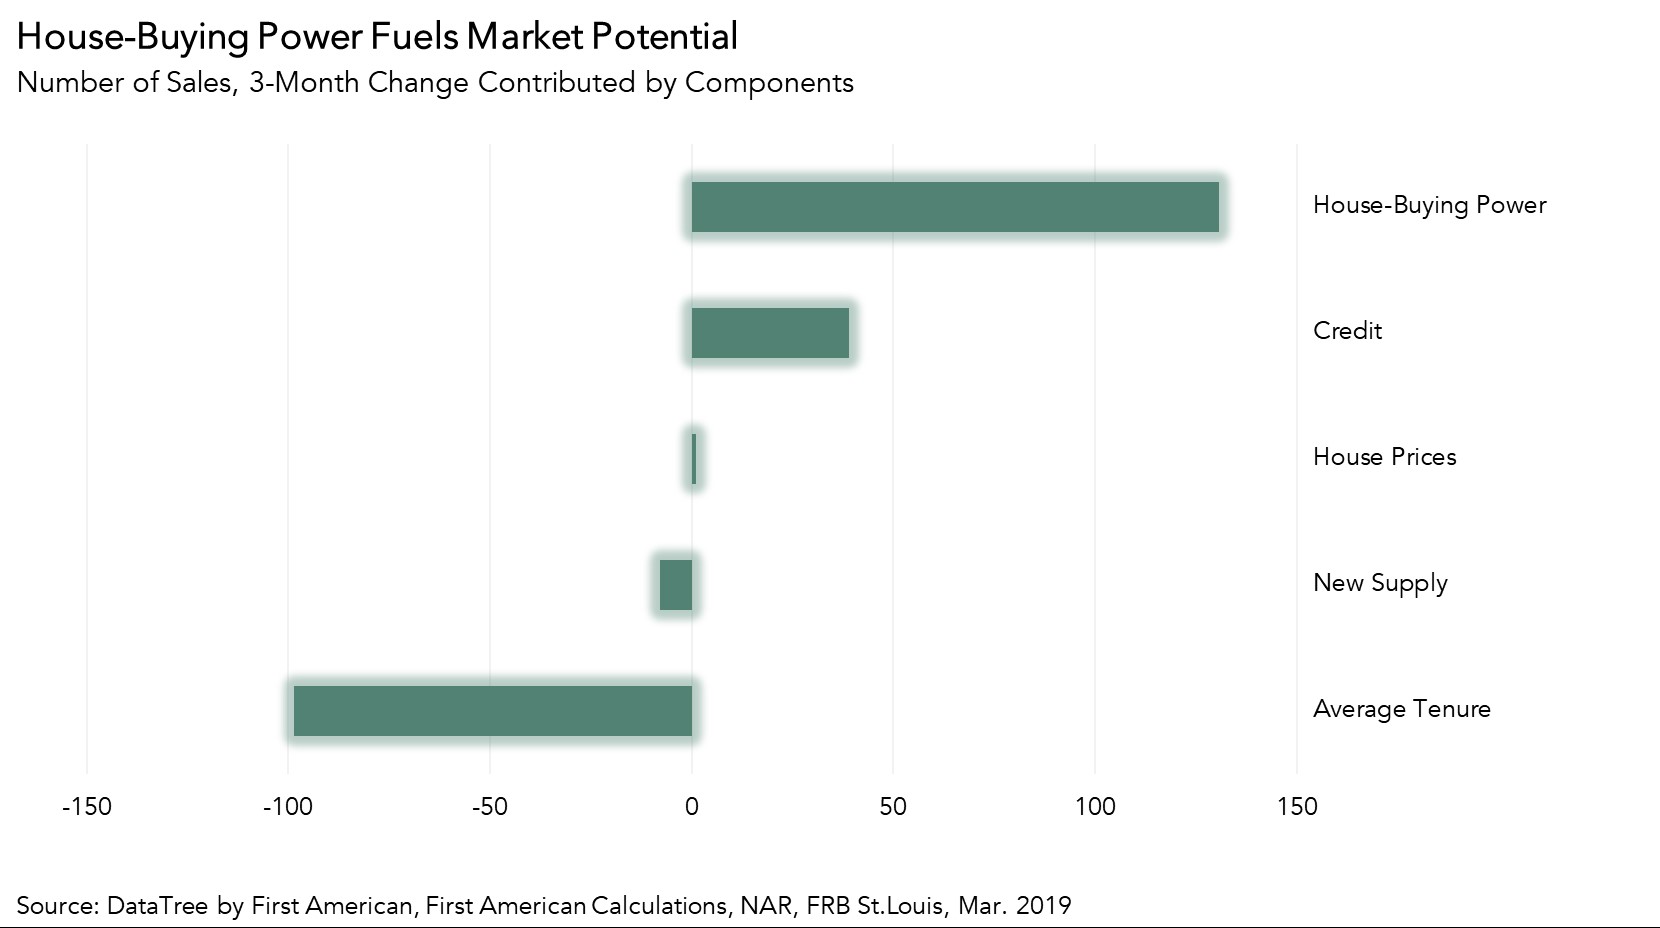
House-Buying Power Fuels Market Potential
The last three months have been kind to potential home buyers. While mortgage rates increased throughout most of 2018, they began to trend downward in December and have continued to fall since then. All the while, average household income has trended up, boosting house-buying power.
The decline in mortgage rates over the last three months may have encouraged some homeowners, who were “rate locked-in” by rising mortgage rates, to re-enter the market. Additionally, millennials that were previously priced out of the market when rates were higher in 2018 are likely to jump back in. The increase in house-buying power directly contributed to a gain of nearly 131,000 potential home sales in the last three months, by far the strongest driver of market potential.
What’s Still Holding Back Market Potential?
Even with the house-buying power boost, the market for existing-home sales is underperforming its potential due to the persisting supply shortage. The supply squeeze is two-fold: the existing homeowner’s dilemma and the lack of new construction. The majority of existing homeowners have mortgages with historically low rates, and there is limited incentive to sell if it will cost them more each month to borrow the same amount of money from the bank. This rate-lock phenomenon has led to a 9 percent yearly increase in tenure length, which reduced market potential by 99,000 sales in the last three months. One way to reduce supply squeeze is to build more new homes, but construction headwinds have prevented homebuilders from keeping up with housing demand. Lack of new home supply directly contributed to a decline of nearly 8,000 potential home sales in the last three months.
A Head Start to Spring Home-Buying Season
Rising house-buying power and limited supply are locked in a tug-of-war as the two strongest forces influencing housing market potential in advance of the spring home-buying season. The increase in house-buying power, in conjunction with favorable market conditions, led to an increase of nearly 161,000 potential home sales over the last three months. The rise in house-buying power overpowered the effects of limited supply. Continuing low mortgage rates and a strong labor market will fuel demand as the spring home-buying season ramps up. In addition, the recent increase in housing starts means home builders are pushing through new construction projects, which should help alleviate the supply shortage in the future. The net effect? We expect the spring home-buying season to be stronger than anticipated just a few months ago.
February 2019 Potential Home Sales
For the month of February, First American updated its proprietary Potential Home Sales Model to show that:
- Potential existing-home sales increased marginally to a 5.17 million seasonally adjusted annualized rate (SAAR), a 1.5 percent month-over-month increase.
- This represents a 54.0 percent increase from the market potential low point reached in February 1993.
- The market potential for existing-home sales declined by 2.9 percent compared with a year ago, a loss of 153,000 (SAAR) sales.
- Currently, potential existing-home sales is 1.6 million (SAAR), or 23.2 percent below the pre-recession peak of market potential, which occurred in March 2004.*
Market Performance Gap
- The market for existing-home sales is underperforming its potential by 2.5 percent or an estimated 127,000 (SAAR) sales.
- The market performance gap increased by an estimated 200,000 (SAAR) sales between January 2019 and February 2019.
Our Potential Home Sales model includes revised homeowner tenure and existing-home sales data, shifting the peak for market potential from February 2005 to March 2004. The model continues to measure the historical relationship between existing-home sales and U.S. population demographic data, price trends in the U.S. housing market, and conditions in the financial market.
What Insight Does the Potential Home Sales Model Reveal?
When considering the right time to buy or sell a home, an important factor in the decision should be the market’s overall health, which is largely a function of supply and demand. Knowing how close the market is to a healthy level of activity can help consumers determine if it is a good time to buy or sell, and what might happen to the market in the future. That is difficult to assess when looking at the number of homes sold at a particular point in time without understanding the health of the market at that time. Historical context is critically important. Our potential home sales model measures what we believe a healthy market level of home sales should be based on the economic, demographic and housing market environments.
About the Potential Home Sales Model
Potential home sales measures existing-homes sales, which include single-family homes, townhomes, condominiums and co-ops on a seasonally adjusted annualized rate based on the historical relationship between existing-home sales and U.S. population demographic data, homeowner tenure, house-buying power in the U.S. economy, price trends in the U.S. housing market, and conditions in the financial market. When the actual level of existing-home sales are significantly above potential home sales, the pace of turnover is not supported by market fundamentals and there is an increased likelihood of a market correction. Conversely, seasonally adjusted, annualized rates of actual existing-home sales below the level of potential existing-home sales indicate market turnover is underperforming the rate fundamentally supported by the current conditions. Actual seasonally adjusted annualized existing-home sales may exceed or fall short of the potential rate of sales for a variety of reasons, including non-traditional market conditions, policy constraints and market participant behavior. Recent potential home sale estimates are subject to revision to reflect the most up-to-date information available on the economy, housing market and financial conditions. The Potential Home Sales model is published prior to the National Association of Realtors’ Existing-Home Sales report each month.

.jpg)
