The housing market underperformed its potential in June 2019, as actual existing-home sales were 1.5 percent below the market’s potential. The market potential for existing-home sales increased 1.1 percent compared with May, according to our Potential Home Sales model.
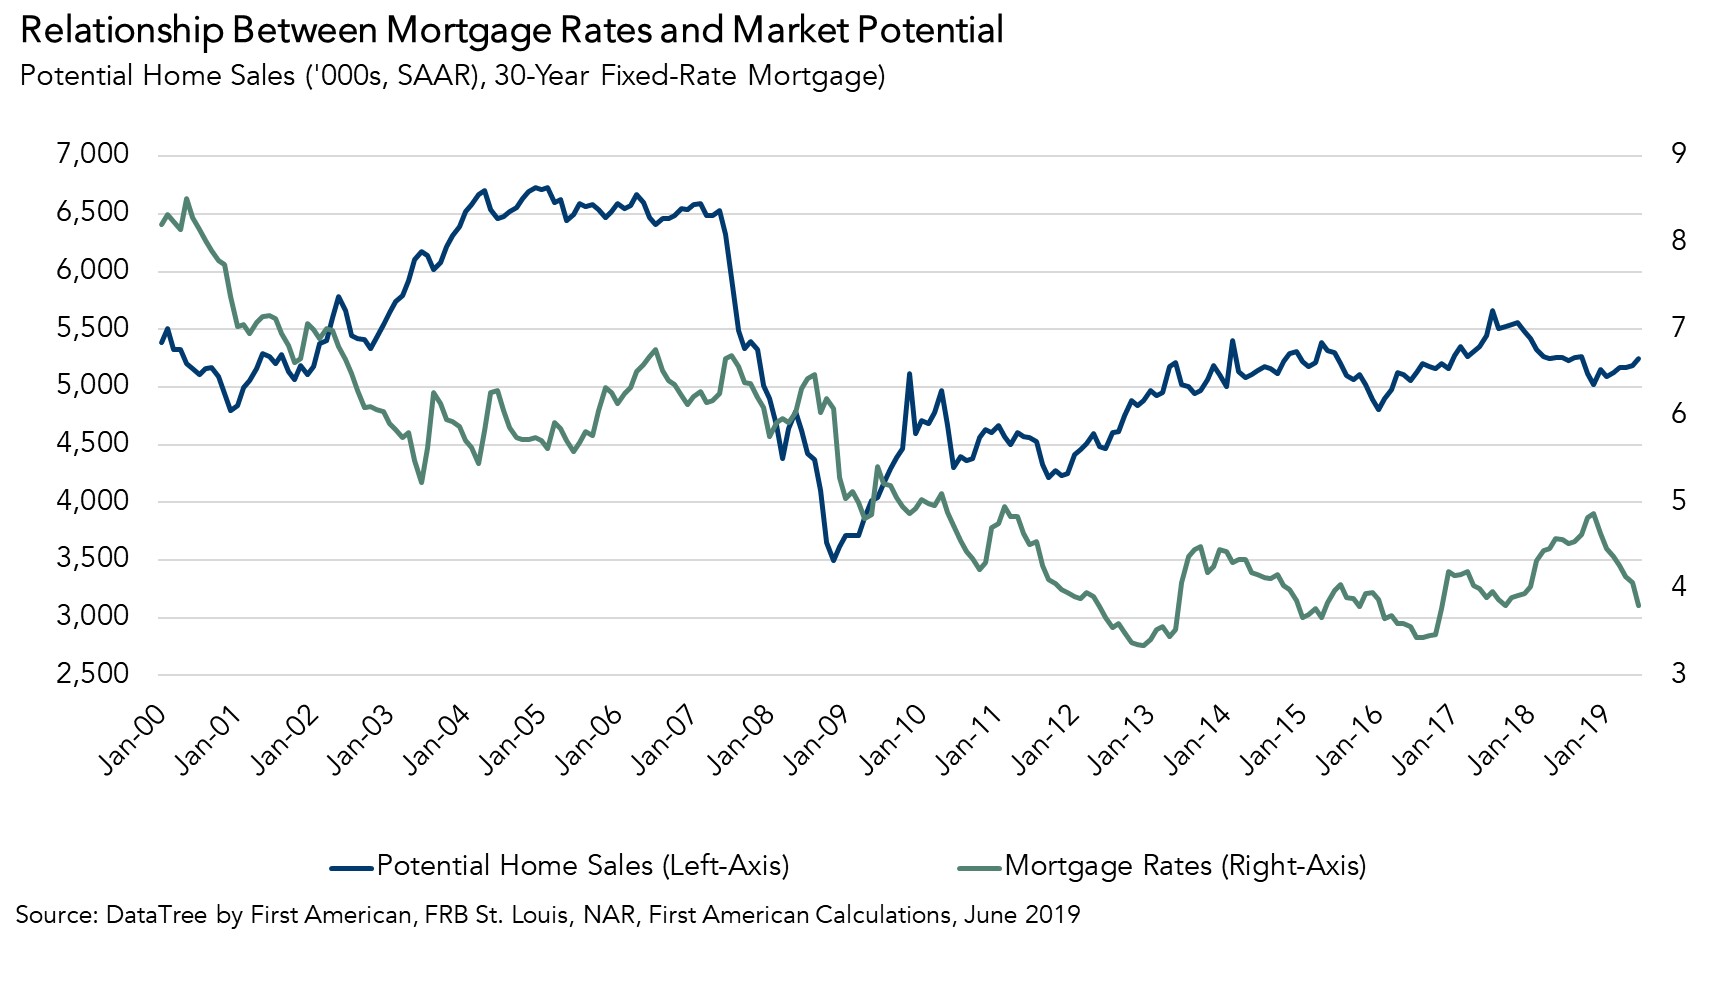
In June, housing market potential benefitted from a 10.7 percent year-over-year increase in consumer house buying power as 30-year, fixed mortgage rates, an important component of consumer house-buying power, fell to their lowest point since November 2016, and declined 0.8 percentage points compared with one year ago. Household income, the other component of consumer house-buying power, continued to the rise as well, increasing 2.5 percent compared with one year ago.
“Market conditions are ripe for increasing home sales with one glaring exception. The supply of homes for sale remains tight, keeping existing home sales below potential.”
What’s the Fed Got to Do with It?
With the Federal Reserve Open Market Committee (FOMC) meeting less than two weeks away, many are wondering about the fate of the Federal Funds Rate, and its impact on the housing market. The CME group estimates the probability of a 25-basis point reduction at 72 percent, virtually a sure thing. Yet, changes to the short-term rate matter little to the housing market because mortgage rates, particularly the 30-year, fixed-rate mortgage, are benchmarked to the 10-year Treasury bond. In fact, since the end of the recession, the 30-year, fixed-rate mortgage has on average remained 1.7 percentage points above the 10-year Treasury bond yield.
In December 2018, the 10-year Treasury bond yield began to decline because of global economic uncertainty and concern about the impact of trade negotiations, and mortgage rates have followed. If the 10-year Treasury bond yield remains as low as it is today, or even continues to decline, it begs the question – what does this mean for housing?
It’s All About House-Buying Power
This month, the surge in house-buying power, driven largely by lower mortgage rates, contributed a gain of 98,800 potential home sales compared with last month and an even more dramatic 272,000 potential home sales compared with last year. Indeed, mortgage rates are approaching the historically low level of 3.44 percent last seen in July 2016. If mortgage rates reach 3.44 percent, house-buying power would increase by $18,000, and potential home sales would increase by 124,300 sales, holding all else equal. Stronger house-buying power benefits the housing market in two ways: it boosts affordability for home buyers and it may encourage some homeowners, who are less “rate locked-in”, to re-enter the market.
The Main Force Impeding Market Potential
While increasing house-buying power improved housing affordability and boosted the incentive to sell, the low supply of homes for sale continues to hold the market back. Tenure length increased by 0.7 percent compared with one month ago, contributing to a loss of nearly 33,000 potential home sales. The homeowner’s prisoners dilemma, rate “lock-in” (albeit less so now) and seniors aging in place have all contributed to rising tenure length.
The housing market is unique because existing homeowners influence both the demand and supply side of the market. In 2018, just over 6 million homes were sold in the U.S. Only 667,000 of those were new home sales, the remaining 5.34 million were existing-home sales. This means historically high tenure length results in both fewer buyers and fewer homes on the market, keeping existing-home sales below potential.
June 2019 Potential Home Sales
For the month of June, First American updated its proprietary Potential Home Sales Model to show that:
- Potential existing-home sales increased marginally to a 5.25 million seasonally adjusted annualized rate (SAAR), a 1.1 percent month-over-month increase.
- This represents a 56.3 percent increase from the market potential low point reached in February 1993.
- The market potential for existing-home sales declined by 0.2 percent compared with a year ago, a loss of 11,170 (SAAR) sales.
- Currently, potential existing-home sales is 1.48 million (SAAR), or 22.0 percent below the pre-recession peak of market potential, which occurred in March 2004.
Market Performance Gap
- The market for existing-home sales is underperforming its potential by 1.5 percent or an estimated 80,150 (SAAR) sales.
- The market performance gap increased by an estimated 18,840 (SAAR) sales between May 2019 and June 2019.
First American Deputy Chief Economist Odeta Kushi contributed to this post.
What Insight Does the Potential Home Sales Model Reveal?
When considering the right time to buy or sell a home, an important factor in the decision should be the market’s overall health, which is largely a function of supply and demand. Knowing how close the market is to a healthy level of activity can help consumers determine if it is a good time to buy or sell, and what might happen to the market in the future. That is difficult to assess when looking at the number of homes sold at a particular point in time without understanding the health of the market at that time. Historical context is critically important. Our potential home sales model measures what we believe a healthy market level of home sales should be based on the economic, demographic and housing market environments.
About the Potential Home Sales Model
Potential home sales measures existing-homes sales, which include single-family homes, townhomes, condominiums and co-ops on a seasonally adjusted annualized rate based on the historical relationship between existing-home sales and U.S. population demographic data, homeowner tenure, house-buying power in the U.S. economy, price trends in the U.S. housing market, and conditions in the financial market. When the actual level of existing-home sales are significantly above potential home sales, the pace of turnover is not supported by market fundamentals and there is an increased likelihood of a market correction. Conversely, seasonally adjusted, annualized rates of actual existing-home sales below the level of potential existing-home sales indicate market turnover is underperforming the rate fundamentally supported by the current conditions. Actual seasonally adjusted annualized existing-home sales may exceed or fall short of the potential rate of sales for a variety of reasons, including non-traditional market conditions, policy constraints and market participant behavior. Recent potential home sale estimates are subject to revision to reflect the most up-to-date information available on the economy, housing market and financial conditions. The Potential Home Sales model is published prior to the National Association of Realtors’ Existing-Home Sales report each month.

.jpg)
