Slowing demand to lease apartments is now reducing demand to own multifamily properties. Declining rent growth, as well as higher interest rates, has limited the prices that prospective buyers can afford to pay for a property, opening a gap in price expectations between buyers and sellers. As a result, multifamily transaction volumes in the fourth quarter, traditionally the most seasonally active quarter for multifamily deal activity, fell to $48 billion, making it the slowest fourth quarter, in terms of dollars, since 2014. It was also the slowest fourth quarter since 2014 in terms of the number of multifamily properties sold.
“As more of these ‘motivated’ deals happen, there will be more comparable transactions with which to evaluate property valuations, which will help reduce pricing uncertainty and, in turn, lead to a more liquid market. Until then, cap rates will likely remain on an upward trajectory.“
With fewer buildings being bought and sold, there are fewer reference points available when attempting to determine a property’s value. These comparable transactions are often referred to as “comps,” and they’re a core component in any acquisition analysis. Fewer deals mean fewer comps, and fewer comps mean greater pricing uncertainty for both buyers and sellers. How will falling multifamily transaction volumes, and therefore the limited number of comparable transactions, impact multifamily cap rates?
Falling Transaction Volumes Pushing Up Cap Rates
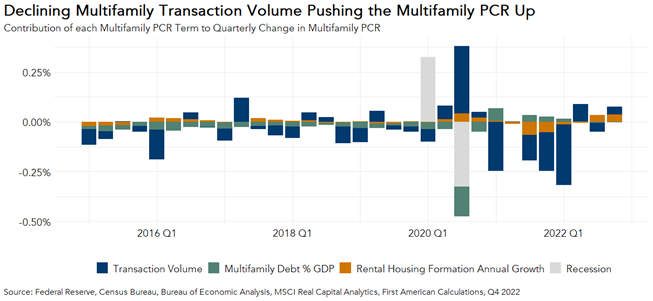
The chart below shows how each component of our Multifamily Potential Cap Rate (PCR) model contributes to changes in the multifamily PCR, by quarter. In the fourth quarter, the multifamily PCR was 4.5 percent, 0.2 percentage points below the actual multifamily cap rate of 4.7 percent, indicating that market fundamentals supported slightly lower cap rates than were observed in the fourth quarter. The most notable shift in the last few quarters is the slowdown in multifamily transaction volume, which is now pushing the multifamily PCR upwards as opposed to being the primary downward driver during the pandemic-era boom. With fewer reference comps and greater pricing uncertainty, sellers will be hesitant to sell since they won’t have a firm idea of what price they’ll get.
Buyers, facing the same uncertainty as well as greater capital costs, are in many cases offering prices far below the expectations of many sellers, whose price expectations are anchored to comparable transactions from earlier in 2022. This pricing gap between buyers and sellers will keep transaction volumes muted, and cap rates elevated, until there is broader market agreement on pricing.
As long as a building is generating sufficient cash flows to service its debt, and there’s no pressing need to sell it, many potential sellers will choose to hold on to an asset rather than sell amidst uncertain conditions. Instead, they’ll wait for the gap between buyer and seller expectations to narrow and then evaluate their options.
Other sellers, like those facing upcoming debt maturities, may not have this flexibility. These sellers will be motivated to lower prices first, and well-capitalized investors are eagerly awaiting their opportunity to swoop in and buy at discounts. As more of these “motivated” deals happen, there will be more comparable transactions with which to evaluate property valuations, which will help reduce pricing uncertainty and, in turn, lead to a more liquid market. Until then, cap rates will likely remain on an upward trajectory.
Fourth Quarter 2022 Multifamily Potential Cap Rate (PCR) Model
- Nationally, the multifamily PCR was 4.5 percent, an increase of 0.1 percentage points as compared with the third quarter of 2022.
- The multifamily PCR decreased by 0.2 percentage points as compared with one year ago.
- In the fourth quarter of 2022, the multifamily PCR was near its 20-year low of 4.4 percent, which was reached in the first quarter of 2022, and was 3.6 percentage points below its third quarter 2001 peak of 8.1 percent.
Multifamily Cap Rate Outlook Gap
- The gap between the actual multifamily cap rate and the multifamily PCR provides insight into the likelihood of shifts in the actual cap rate. If the gap is large, market fundamentals may not support current cap rates and there is a greater likelihood actual cap rates will shift. If the gap is small, market fundamentals support current cap rates, indicating cap rates are more likely to remain near where they are.
- In the fourth quarter of 2022, the actual national multifamily cap rate was 0.2 percentage points higher than the potential cap rate, signaling that both the actual and potential multifamily cap rate appear to have bottomed out in 2022 and are now increasing.
Fourth Quarter 2022 All-Asset PCR Model
First American’s All-Asset PCR Model estimates a potential national cap rate for all asset classes based on several CRE market fundamentals, including rental income, prevailing occupancy rates, interest rates, the amount of commercial mortgage debt in the economy, and recent property price trends.
- The all-asset PCR was 5.0 percent in the fourth quarter of 2022, an increase of 0.4 percentage points as compared with the third quarter of 2022.
- The all-asset PCR increased by 0.5 percentage points as compared with the fourth quarter of 2021.
- In the fourth quarter of 2022, the all-asset PCR was 0.8 percentage points above its 20-year low of 4.2 percent, which occurred in the second quarter of 2022, and 3.9 percentage points below its third quarter 2001 peak of 8.9 percent.
All-Asset PCR Model Outlook Gap
- The all-asset actual cap rate was 0.6 percentage points higher than the potential cap rate, which suggests that market fundamentals in the fourth quarter supported lower actual cap rates than were observed.
- The gap between the actual all-asset cap rate and the potential all-asset cap rate expanded in the fourth quarter to 0.6 percent from 0.5 percent in the third quarter. Notably, though the PCR remained below the actual all-asset cap rate throughout 2022, this gap has been shrinking since the first quarter of 2022, signaling that market fundamentals are now supporting higher cap rates.
About the Multifamily Potential Cap Rate Model
The multifamily Potential Cap Rate (PCR) Model estimates cap rates based on the historical relationship between multifamily transaction volume, annual changes in renter household formation, and multifamily mortgage flows. The multifamily PCR Model uses these metrics to establish a potential cap rate level that is supported by these market fundamentals. When actual multifamily cap rates are significantly above the multifamily PCR, it indicates that market fundamentals supported lower cap rates than were observed. Conversely, when actual cap rates are significantly below the potential cap rate level, market fundamentals supported higher cap rates than were observed. Multifamily cap rates are aggregated nationally, and the PCR Model is updated quarterly.
A cap rate is a measure of estimated yield, or the return, on an investment property assuming no debt is used to purchase it. Cap rates are calculated by dividing an asset’s net operating income (NOI) by its value. NOI is an asset owner’s remaining income after covering operating expenses, but before servicing debt. Since cap rates do not take debt service into consideration, cap rates are a measure of what is called unlevered yield.


