Surging mortgage rates have suppressed demand for home purchases by reducing affordability, which has prevented many renters from transitioning to homeownership. As a result, rental demand has remained strong and real estate investor interest in multifamily properties has remained high. Multifamily transaction volume broke records in 2021, and preliminary third quarter 2022 data indicates continued strength.
The strong investor demand has kept multifamily capitalization (cap) rates near all-time lows. What’s driving the persistent demand to own multifamily properties? And what might prompt a softening that could lead cap rates to swing upward?
"Third quarter multifamily leasing activity has slowed meaningfully. Leasing activity is facing headwinds, and the combination of slowing rent growth and higher interest rates is beginning to slow multifamily price growth as well."
Introducing the Multifamily Potential Cap Rate Model
To help answer these questions, we developed the First American Multifamily Potential Cap Rate model, an asset-class specific version of the All-Asset Potential Cap Rate (PCR) model. Cap rates relate the income generated by a multifamily property to its value, which provides investors with a measure of potential return on an investment. For example, a multifamily property purchased for $100,000 that generates income of $10,000 a year has a cap rate of 10 percent. Much like the PCR, the multifamily PCR model estimates a potential national multifamily cap rate based on commercial real estate (CRE) and macroeconomic market fundamentals, including multifamily transaction volume, multifamily mortgage flows, and annual changes in renter household formation. Based on our dynamic simulation multifamily PCR model, we can breakdown the forces driving multifamily cap rates today.
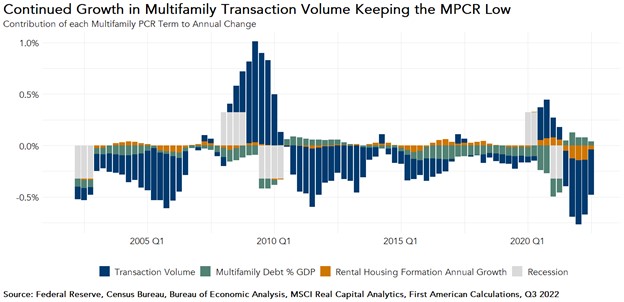
Breakdown – Understanding the Forces Influencing the Multifamily PCR
Transaction volume is the predominant driver of the multifamily PCR in most periods, as it is a direct measure of demand, which drives prices and, therefore, cap rates. The recent surge in multifamily transaction activity comes from a shortage of housing units that predates the pandemic, but was exacerbated by the rapid adoption of remote work during the pandemic. Given all the additional time spent at home, people sought out new living arrangements that were further from urban centers and more spacious. This created a new and potentially long-lasting increase in the demand for housing. Greater housing demand impacted both the home purchase and apartment rental market, and as home prices have skyrocketed, so have apartment rents. A limited supply of multifamily properties combined with soaring rents quickly made apartment buildings more desirable than ever to investors. As investors rushed to buy multifamily properties, prices went up and cap rates went down.
As Leasing Activity Stalls, Price and Rent Growth Decelerate
While multifamily fundamentals remain strong, a deceleration in multifamily rent growth and price growth is already underway. In the third quarter, annual rent growth was 5.7 percent, compared with 9.3 percent in the prior quarter. While unemployment remains low, wage growth has not kept pace with the rising cost of living, and consumers appear to be running through some of the excess savings that they accumulated during the pandemic.
Confronted with inflation-driven higher prices, fewer people can afford to cover their rent expense, which decreases the demand to lease apartments. In addition to higher prices, ongoing economic uncertainty may discourage new demand for rental units by keeping roommates from decoupling and thereby decrease new rental household formation. This is beginning to play out in the leasing market, and third quarter multifamily leasing activity has slowed meaningfully. Leasing activity is facing headwinds, and the combination of slowing rent growth and higher interest rates is beginning to slow multifamily price growth as well.
Despite a retreat from the frenzied levels of last year, multifamily fundamentals remain on solid footing. In the second quarter of 2022, the actual and potential cap rates for multifamily assets were near multi-decade lows of 4.3 percent and 4.5 percent, respectively. A multifamily PCR that is slightly higher than the actual multifamily cap rate implies that market fundamentals support a slightly higher cap rate than the prevailing market cap rate, and we expect the multifamily PCR to begin to increase gradually towards the end of 2022.
Second Quarter 2022 Multifamily Potential Cap Rate (PCR) Model
- Nationally, the multifamily PCR was 4.4 percent, an increase of 0.1 percentage points as compared with the first quarter of 2022.
- The multifamily PCR decreased by 0.6 percentage points as compared with one year ago.
- In the second quarter of 2022, the multifamily PCR was near its 20-year low of 4.3 percent, which was reached in the first quarter, and was 3.7 percentage points below its third quarter 2001 peak of 8.1 percent.
Multifamily Cap Rate Outlook Gap
- The gap between the actual multifamily cap rate and the multifamily PCR provides insight into the likelihood of shifts in the actual cap rate. If the gap is large, market fundamentals may not support current cap rates and there is a greater likelihood actual cap rates will shift. If the gap is small, market fundamentals support current cap rates, indicating cap rates are more likely to remain near where they are.
- In the second quarter of 2022, the actual national multifamily cap rate was 0.1 percentage points lower than the potential cap rate, which signals that the multifamily PCR will remain low, around approximately 4.4 percent, in the third quarter.
Second Quarter 2022 All-Asset PCR Model
First American’s All-Asset PCR Model estimates a potential national cap rate for all asset classes based on several CRE market fundamentals, including rental income, prevailing occupancy rates, interest rates, the amount of commercial mortgage debt in the economy, and recent property price trends.
- The all-asset PCR was 4.6 percent in the second quarter of 2022, an increase of 0.3 percentage points as compared with the first quarter of 2022.
- The all-asset PCR remained virtually unchanged compared with one year ago.
- In the second quarter of 2022, the all-asset PCR was 0.4 percentage points above its 20-year low of 4.3 percent, and 4.3 percentage points below its third quarter 2001 peak of 8.9 percent.
All-Asset PCR Model Outlook Gap
- The all-asset actual cap rate was 0.6 percentage points higher than the potential cap rate. This suggests that market fundamentals in the second quarter supported lower actual cap rates than were observed.
- The gap between the actual all-asset cap rate and the potential all-asset cap rate narrowed in the second quarter to 0.6 percent from 0.9 percent in the first quarter, signaling that market fundamentals are beginning to support higher cap rates.
- We expect the all-asset potential cap rate to increase modestly for the remainder of 2022.


