When inflation first began to surge in 2021, many believed it would be transitory. Inflation has remained stubbornly high, however, prompting the Federal Reserve to tighten monetary policy. In response, the yield on the 10-Year Treasury note has more than doubled, from 1.5 percent at the end of last year to nearly 3.5 percent in mid-June. The Fed’s increases to the federal funds rate, which began in May this year, indirectly impact longer-term yields, such as the 10-Year Treasury note. However, quantitative tightening, the Fed’s other tool to tighten monetary policy, will directly impact the 10-year Treasury bond. The Fed began quantitative tightening in June and is expected to continue quantitative tightening in the months ahead, so the yield on the 10-year Treasury is therefore expected to increase further.
“Looking ahead, cap rates do appear poised to move upwards as investors shift their risk tolerance. However, more moderate CRE price growth reflects a shift to a new normal, rather than significant industry disruption.”
Investors often view the interest rate paid on a 10-year Treasury note as “risk free,” so when considering investments with greater risk they typically seek a return greater than the 10-year Treasury yield. Since capitalization (cap) rates are a measure of return on an asset, higher “risk-free” rates mean sellers will need to reduce their price expectations or increase cash flow, if that’s an option, to entice buyers seeking competitive yields, which should also push cap rates up.
So far, this hasn’t happened. Cap rates remain near all-time lows and commercial real estate (CRE) price growth in the first quarter remained relatively robust, although slower than the record growth seen in the fourth quarter of last year. However, we know that interest rates have increased dramatically in the second quarter and are likely to continue rising, given the Fed’s efforts to fight inflation. So, how will rising interest rates impact cap rates throughout the rest of the year?
Slowing CRE Price Growth Likely to Push Cap Rates Up
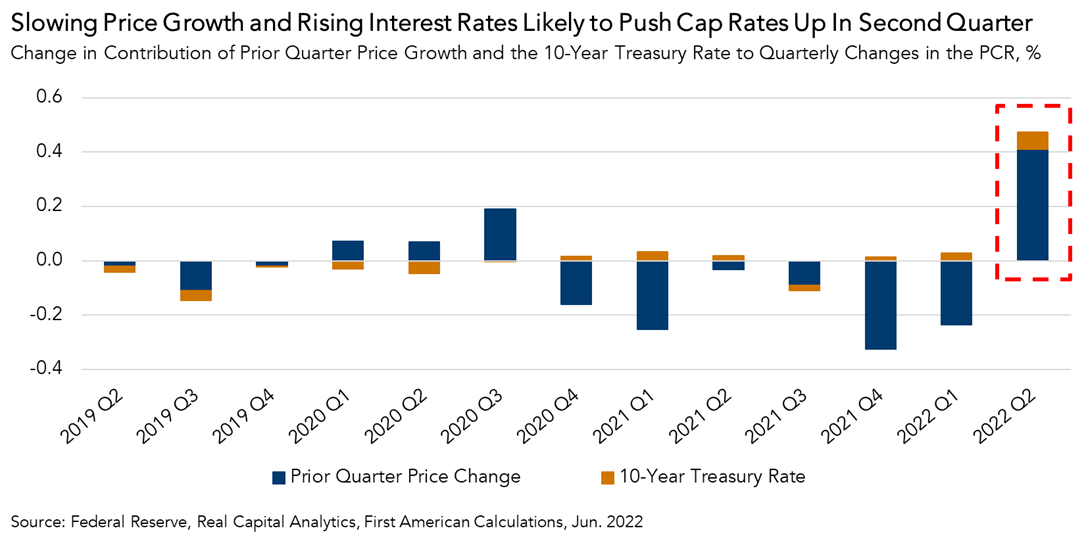
First American’s Potential Cap Rate (PCR) Model, which estimates a potential national cap rate based on several CRE market fundamentals, including rental income, prevailing occupancy rates, interest rates, the amount of commercial mortgage debt in the economy, and recent property price trends, suggests that, while interest rates influence cap rates, recent CRE property price growth is a more significant driver. For example, in the first quarter of 2022, interest rates put upward pressure on the potential cap rate, but the downward pressure from record price growth in the previous quarter was much greater, so the potential cap rate declined to 4.3 percent, approximately 1 percent below the actual national cap rate of 5.3 percent.
In the first quarter, however, national CRE price growth slowed on a quarter-over-quarter basis and is expected to push potential cap rates up. According to the PCR Model, the moderation in quarterly price growth in the first quarter will lead to a modest increase in the potential cap rate in the second quarter, which suggests actual cap rates will follow. As shown in the chart above, higher interest rates contributed to an increase in the potential cap rate, but upward pressure from slower CRE price growth will be a much more significant contributor to the increase in the second quarter potential cap rate.
A Return to Normal
It’s worth noting that decelerating CRE price growth was not distributed evenly across asset classes. Multifamily and industrial assets set first-quarter price growth records, increasing at a faster rate than any other first quarter in the past 20 years, while office and retail assets were a drag on overall CRE price growth in the first quarter. However, a record amount of industrial square footage is currently under construction and expected to come to market later this year, which may slow price growth for industrial assets and put further upward pressure on the potential cap rate as the year progresses.
While interest rates are higher today than they were a year ago, they are near mid-2018 levels. Despite a comparable interest rate environment in 2018, commercial transaction volume increased by nearly 16 percent from the first quarter to the fourth quarter of that year. In other words, despite interest rates that are spooking investors today, the CRE market in 2018 nevertheless showed that the demand to own commercial property grew throughout the year. So, looking ahead, cap rates do appear poised to move upwards as investors shift their risk tolerance. However, more moderate CRE price growth reflects a shift to a new normal rather than significant industry disruption.
First Quarter 2022 Potential Cap Rate
- Nationally, the potential cap rate was 4.3 percent, a decrease of 0.2 percentage points as compared with the fourth quarter of 2021.
- The potential cap rate decreased by 0.4 percentage points as compared with one year ago.
- Currently, the potential cap rate is at its lowest level in more than 20 years, 4.6 percentage points below its third quarter 2001 peak of 8.9 percent.
Cap Rate Outlook Gap
- In the first quarter of 2022, the national actual cap rate was 1.0 percentage points higher than the potential cap rate. However, given decelerating price growth in the first quarter and continued upward movement of interest rates, we anticipate that the potential cap rate will increase in the second quarter.
- The gap between the actual cap rate and the potential cap rate increased 0.4 percentage points between the fourth quarter of 2021 and the first quarter of 2022.
Next Release
The PCR Model is updated quarterly with new data. Look for the next edition of the PCR Model in the third quarter of 2022.
About the Potential Cap Rate Model
The Potential Cap Rate (PCR) Model estimates cap rates based on the historical relationship between interest rates, rental income, prevailing occupancy rates, the amount of commercial mortgage debt in the economy, and recent property price trends. The PCR Model uses these metrics to establish a potential cap rate level that is supported by these market fundamentals. When actual cap rates are significantly above the potential cap rate level, there is a greater chance actual cap rates will decline. Conversely, when actual cap rates are significantly below the potential cap rate level, there is a greater chance actual cap rates will increase.
Potential cap rates are aggregated nationally and include all major asset classes: multifamily, retail, industrial, office and lodging. The PCR Model is updated quarterly.
A cap rate is a measure of estimated yield, or the return, on an investment property assuming no debt is used to purchase it. Cap rates are calculated by dividing an asset’s net operating income (NOI) by its value. NOI is an asset owner’s remaining income after covering operating expenses, but before servicing debt. Since cap rates do not take debt service into consideration, cap rates are a measure of what is called unlevered yield.


