In November 2023, the Real House Price Index (RHPI) leaped 11 percent on an annual basis. Affordability improved modestly on a monthly basis, as mortgage rates fell from the previous month. Two factors drove the sharp annual decline in affordability – a 7.7 percent annual increase in nominal house prices, according to our First American Data & Analytics House Price Index, and a 0.6 percentage point increase in the 30-year, fixed mortgage rate compared with one year ago. For home buyers, holding prices constant, the only way to mitigate the loss of affordability caused by higher mortgage rates is with an equivalent, if not greater, increase in household income. Even though household income increased 3.4 percent since November 2022 and boosted consumer house-buying power, it was not enough to offset the affordability loss from higher rates and rising nominal prices.
Nationally, house prices reached their peak in May 2022 before gradually declining to a low point in November 2022. Since then, house prices have resumed an upward trend as housing demand continues to outpace supply. Despite affordability challenges driven by elevated mortgage rates, November 2023 data indicates that home prices reached a new peak for the tenth month in a row. Of course, real estate is local, so it’s important to analyze if this trend is consistent across markets.
“The outlook for house prices varies by geography. Traditionally more expensive coastal markets and those that overheated during the pandemic may face greater risk of price corrections.”
The Fall from Peak
The re-acceleration in house prices varies by market, but it’s clear that prices in many markets are rising. In January 2023, prices had declined from their recent peaks in 35 of the top 50 markets we track. By November of 2023, that number dropped to 15 markets. While the general expectation was that a higher mortgage-rate environment would prompt house prices to adjust downward, the lack of housing supply has kept a floor on how low prices can go.
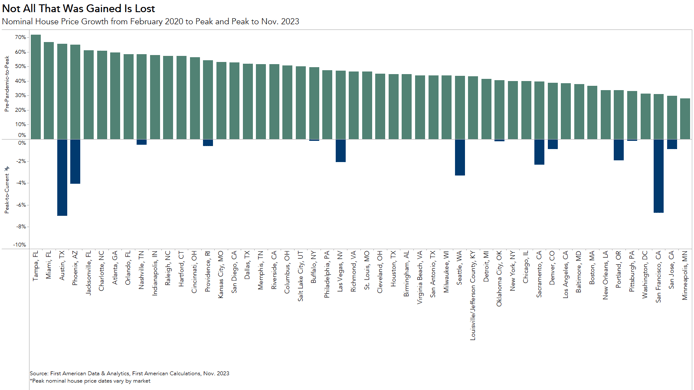
In November, the four markets with the largest declines from peak-to-current were Austin, Texas (-7.0 percent), San Francisco (-6.7 percent), Phoenix (-4.1 percent), and Seattle (-3.3 percent). Yet, the reasons prices declined differs between markets. Austin and Phoenix were at the epicenter of the pandemic boom. In the chart below, the top half of the chart indicates pre-pandemic (February 2020) to peak1 house price growth. Austin came in third and Phoenix fourth for the most house price appreciation over the pandemic – a whopping 65 percent from February 2020 until the peak in May 2022 for both markets. And, as the saying goes: what goes up, must come down.
House prices in San Francisco and Seattle, the other two markets that topped the chart for most severe price declines from peak-to-current, did not grow as rapidly during the pandemic relative to Austin and Phoenix. In fact, out of the top 50 markets, San Francisco and Seattle were in the bottom half for price growth. They are also considered some of the most overvalued markets, meaning the median existing-home sale price exceeded house-buying power in these markets, which is why prices have fallen. The housing market in San Francisco was overvalued by $539,000 in November. Seattle was overvalued by approximately $217,000. San Francisco and Seattle are traditionally more expensive markets, so when mortgage rates increased, the pullback in demand was more pronounced.
1Peak date varies by market.
Even Cooling Markets Heated Up in 2023
While house prices remain lower in 15 markets than during their respective recent peaks, prices in these markets still heated up in 2023. In Seattle, for example, house prices fell more than 8 percent from April 2022 until early 2023, but then house prices began to rise once more. Additionally, even though prices fell from their peak, the declines did not erase all the equity gains accumulated by homeowners during the pandemic boom. However, this analysis highlights that the outlook for house prices varies by geography. Traditionally more expensive coastal markets and those that overheated during the pandemic may face greater risk of price corrections.
For more analysis of affordability, please visit the Real House Price Index. The RHPI is updated monthly with new data. Look for the next edition of the RHPI the week of February 5, 2024. Starting this month, the monthly RHPI analysis will be published earlier in the month.
Sources:
• First American Data & Analytics
• Freddie Mac
• Census Bureau
November 2023 Real House Price Index Highlights
The First American Data & Analytics’ Real House Price Index (RHPI) showed that in November 2023:
- Real house prices decreased 4.6 percent between October 2023 and November 2023.
- Real house prices increased 11.0 percent between November 2022 and November 2023.
- Consumer house-buying power, how much one can buy based on changes in income and mortgage rates, increased 2.1 percent between October 2023 and November 2023, and decreased 3.3 percent year over year.
- Median household income has increased 3.4 percent since November 2022 and 87.5 percent since January 2000.
- Real house prices are 53.9 percent more expensive than in January 2000.
- Unadjusted house prices are now 58.3 percent above the housing boom peak in 2006, while real, house-buying power-adjusted house prices are 7.7 percent above their 2006 housing boom peak.
November 2023 Real House Price State Highlights
- The five states with the greatest year-over-year increase in the RHPI are: Alaska (+21.1 percent), Maine (+20.0 percent), New Mexico (+17.5 percent), New Jersey (+17.4 percent), and Indiana (+17.1 percent).
- There were no states with a year-over-year decrease in the RHPI.
November 2023 Real House Price Local Market Highlights
- Among the Core Based Statistical Areas (CBSAs) tracked by First American Data & Analytics, the five markets with the greatest year-over-year increase in the RHPI are: Cincinnati (+21.3 percent), Boston (+19.6 percent), San Diego (+18.6 percent), Chicago (+18.3 percent), and Hartford, Conn. (+17.4 percent).
- There were no markets with a year-over-year decrease in the RHPI.
Next Release
The next release of the First American Data & Analytics’ Real House Price Index will take place the week of February 5, 2024.
About the First American Data & Analytics’ Real House Price Index
The traditional perspective on house prices is fixated on the actual prices and the changes in those prices, which overlooks what matters to potential buyers - their purchasing power, or how much they can afford to buy. First American Data & Analytics’ proprietary Real House Price Index (RHPI) adjusts prices for purchasing power by considering how income levels and interest rates influence the amount one can borrow.
The RHPI uses a weighted repeat-sales house price index that measures the price movements of single-family residential properties by time and across geographies, adjusted for the influence of income and interest rate changes on consumer house-buying power. The index is set to equal 100 in January 2000. Changing incomes and interest rates either increase or decrease consumer house-buying power. When incomes rise and mortgage rates fall, consumer house-buying power increases, acting as a deflator of increases in the house price level. For example, if the house price index increases by three percent, but the combination of rising incomes and falling mortgage rates increase consumer buying power over the same period by two percent, then the Real House Price index only increases by 1 percent. The Real House Price Index reflects changes in house prices, but also accounts for changes in consumer house-buying power.
Disclaimer
Opinions, estimates, forecasts and other views contained in this page are those of First American’s Chief Economist, do not necessarily represent the views of First American or its management, should not be construed as indicating First American’s business prospects or expected results, and are subject to change without notice. Although the First American Economics team attempts to provide reliable, useful information, it does not guarantee that the information is accurate, current or suitable for any particular purpose. © 2024 by First American. Information from this page may be used with proper attribution.


