
Key Points:
- Existing-home sales are expected to increase modestly in May despite higher mortgage rates.
- Markets with more normal new-listing levels tend to have more normal sales activity.
- Affordability remains a constraint, but the new listings gap is the clearer driver.
Existing-home sales are expected to increase modestly in May for the second consecutive month, according to our Existing-Home Sales Outlook Report. That is welcome progress for the spring home-buying season, especially because mortgage rates have moved higher again. The average 30-year, fixed mortgage rate increased from 6.05 percent in February to roughly 6.3 percent in April, reducing house-buying power by approximately $11,000. Affordability remains better than a year ago, but the recent rebound in rates has slowed the momentum buyers carried into spring.
The improvement in sales should also be kept in perspective: the housing market continues to operate below its pre-pandemic normal. Nationally, April sales were nearly 18 percent below their April 2018-2019 average, while new listings were also 18 percent below normal. In other words, the market is not just short of buyers, it is also short of sellers. Of course, real estate is local, and national averages can mask important differences across markets. Existing-home sales activity in some markets is much closer to pre-pandemic conditions, while others remain deeply constrained. The question is: what separates them?
“Sales recover where sellers return, but only when buyers can reach the price.”
Where Sellers Return, Sales Follow
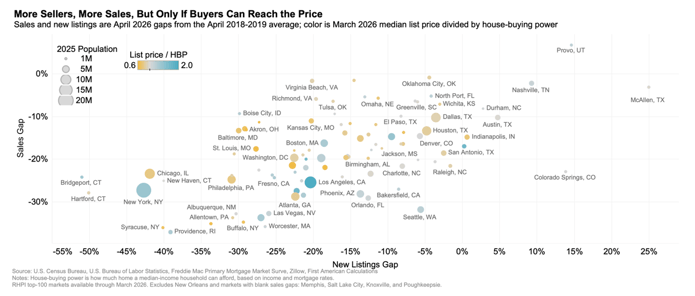
We’ve charted below how markets are performing relative to their pre-pandemic (2018-2019) levels in existing home sales and new listings. Across markets, the pattern is clear. Sales activity tends to be closer to normal in places where new listings have recovered more fully. Provo, Utah, is the standout, with both sales and new listings above their pre-pandemic average. Nashville, Tenn., and McAllen, Texas, also show relatively strong new listing recoveries, and sales in those markets are much closer to their pre-pandemic average than in many other parts of the country.
At the other end of the spectrum, markets with deep listing shortfalls tend to have weaker sales activity. New listings and sales remain far below pre-pandemic average levels in Bridgeport, Conn., Hartford, Conn., Providence, R.I., Rochester, N.Y., and Albuquerque, N.M. When fewer homeowners list their homes for sale, there are fewer opportunities for buyers to transact. New listings can also create their own demand, since many sellers become buyers in the same market. In a market where many homeowners are locked in by low pandemic-era mortgage rates, each new listing can help unlock both the supply and demand sides of a transaction.
Listing Price Alignment with House-Buying Power Also Matters
But listings are only part of the equation. Buyers still need to be able to reach the price of the homes that are listed. That is why the chart also shows the ratio of median list price to house-buying power. House-buying power measures how much home a median-income household can afford, based on income and mortgage rates. A higher ratio means listed homes are further out of reach.
This affordability layer helps explain why more supply does not always translate neatly into more sales. In markets such as Provo, Utah, Nashville, Tenn., McAllen, Texas, and North Port, Fla., new listings are closer to, or above, pre-pandemic norms, and sales are also closer to normal. In these markets, listed homes are also priced relatively closer to local house-buying power, helping buyers turn more options into actual purchases.
In higher-cost markets, such as Los Angeles and San Diego, listed homes remain far above local house-buying power, and sales remain well below pre-pandemic norms. San Jose offers a slightly different lesson: new listings are roughly back to normal, but its sales recovery is only around the national average, underscoring that supply alone is not enough. The monthly payment still has to work.
Where the Recovery Goes from Here
The spring market is improving, but the improvement is modest and below last year’s level. More sellers are returning in some markets, and that is helping sales activity move closer to normal. Yet higher mortgage rates and stretched affordability continue to cap the recovery. The healthiest markets are not just the ones with more listings. They are the ones where more buyers can still reach the price.
May 2026 Existing-Home Sales Outlook Highlights
For the month of May, First American updated its Existing-Home Sales Outlook Report to show that:
- Existing-home sales for May are expected to increase 0.3 percent from last month’s pace of sales, but remain 0.2 percent lower compared with the pace of sales a year ago.
- The only contributor to the projected monthly increase in existing-home sales is a resilient economy (+0.4 percent).
Methodology
Our Existing-Home Sales Outlook Report ‘nowcasts’ existing-home sales, which include single-family homes, townhomes, condominiums, and co-ops on a seasonally adjusted annualized rate based on the historical relationship between existing-home sales, U.S. demographic trends, house-buying power, and the prevailing financial and economic conditions, as well as momentum, a weight assigned to past values. Please note that the Existing-Home Sales Outlook Report is based on assumptions about demographic, economic and financial conditions. Actual values may differ from those projected. Recent existing-home sales estimates are subject to revision to reflect the most up-to-date information available on the economy, housing market and financial conditions.