Key Points:
- National affordability improved on an annual basis for the sixth consecutive month, yet remains low historically.
- In deciding whether to rent or own, it’s important to remember the wealth-building power of equity accumulation.
- Even homeowners who bought at the height of the housing boom in 2006 have gained approximately $181,000 in equity.
Affordability has been challenging amid the surge in mortgage rates since 2022, but the trend has become more encouraging. On a year-over-year basis, affordability has now improved for six consecutive months because of slower price appreciation, income growth, and moderating mortgage rates. The affordability gains are broad, with 35 of the top 50 markets posting annual improvement, and 48 of 50 improving over the previous month. That momentum matters, because it’ helps some potential buyers to realize one of the most powerful and enduring benefits of homeownership – once you own, equity gains can offset a large share of your ongoing housing costs over time. In other words, the short-term challenge of scraping together a down payment coexists with the long-run financial benefits that make homeownership so appealing.
“Affordability should continue to improve, allowing more households to unlock the ‘homeownership’ door and start the equity-building journey that turns a house into a wealth-generating asset.”
Does it Still Make Sense to Buy?
As we discussed in our analysis last year, for those trying to buy a home, house-price appreciation can be intimidating and makes the purchase more expensive, all else equal. Yet, once the home is purchased, that same appreciation becomes a wealth-generating tailwind. Even when appreciation cools, as it has for the past 20 months, monthly principal payments steadily build equity. As potential first-time buyers consider homeownership in today’s market, the decision should start with lifestyle—how long you plan to stay, how much flexibility you want, and whether you’re ready for the responsibilities that come with owning. Then compare the costs—and the potential future benefits—of owning to the cost of renting.
Renting can be the best choice for an individual or family for a variety of reasons. It provides immediate shelter with fewer strings attached. It offers mobility for career or family changes, reduces exposure to unexpected repair bills, and offers greater budgeting simplicity. For many households, renting is the right decision for right now—sometimes as a bridge to ownership, sometimes as a long-term fit. The goal in either case is the same -- stable, suitable housing that supports your life.
Comparing Renting and Owning
In our rent-versus-own analysis, the annual cost of renting is the rent paid that year for a home or apartment, while the annual cost of owning a home includes taxes, repairs, homeowners insurance, and the mortgage principal and interest payments. To calculate the annual cost of homeownership, we assume a 30-year, fixed-rate mortgage with a 5 percent down payment on a median-priced home. We then adjust for equity accumulation. If house prices decline, the equity reduction is added to the annual cost of owning. On the other hand, if prices rise, the equity gained reduces the annual cost of owning. When the annual equity gain exceeds the other ownership costs, the home effectively ‘pays you’ to live there.
The Owner-Renter Gap
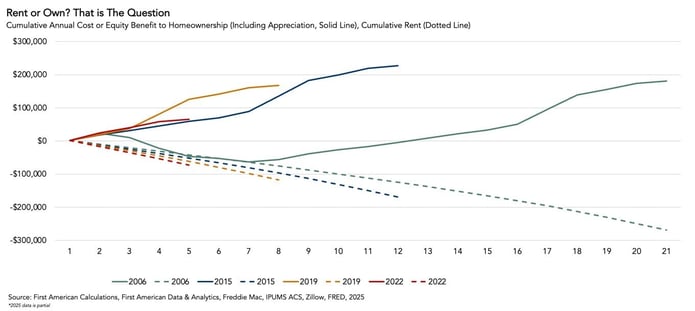
We can track how homeowners build wealth over time relative to renters. The chart below compares the cumulative wealth gained from owning with the cumulative rent paid for four purchase windows—homes bought at the peak of the housing bubble in 2006 to current, homes bought 10 years ago, homes bought just before the pandemic in 2019, and homes bought at the start of monetary tightening in 2022. Across all four intervals, homeowners who stayed long enough saw equity gains exceed cumulative ownership costs. Put differently, time in the home allowed equity accumulation to offset the other costs of ownership.
- Homes Purchased at Peak of the Housing Bubble in 2006 to Current – Equity Gained $181,300: A median-priced home purchased in 2006 carried first-year principal, interest, taxes, and insurance of just over $23,000. Prices then fell, so lost equity raised the cost of owning on a cumulative basis until price growth turned positive again in 2012. Since then, prices have increased annually, with exceptionally strong gains during the pandemic. The net result for the homeowner is approximately $181,300 in cumulative wealth generated from price appreciation, while a comparable renter paid about $269,000 in rent over the same period.
- Homes Purchased in 2015 to Current – Equity Gained $227,000: A buyer who entered the market 10 years ago realized an even larger benefit, about $227,000, because prices did not decline annually during that span. A renter over the same period paid roughly $169,000 in cumulative rent.
- Homes Purchased Just Prior to the Pandemic in 2019 to Current – Equity Gained $168,000:
For a 2019 buyer, just before the pandemic era, the wealth-generating benefit is approximately $168,000. A comparable renter paid an estimated $117,000 in rent over that time. - Homes Purchased in the Year of Monetary Tightening – Equity Gained $66,000: The Federal Reserve’s rate hikes in 2022 increased borrowing costs and chilled housing market activity. Even so, the cumulative wealth benefit after accounting for all of the other costs of ownership since then is roughly $66,000 on a median-priced home, while a renter in that interval paid about $73,000 in rent. The early equity path is understandably more modest, but every monthly principal payment increases equity and helps accumulate wealth.
Homeownership Still Pays
The takeaways are simple—homeownership can reward patience, and affordability is slowly improving. With six months of year-over-year improvement and broad gains across major markets, the pathway into ownership is gradually widening. If current trends hold—income growth outpacing price growth and mortgage rates easing—affordability should continue to improve, allowing more households to unlock the ‘homeownership’ door and start the equity-building journey that turns a house into a wealth-generating asset.
Sources:
• First American Data & Analytics
• Freddie Mac
• Census Bureau
August 2025 Real House Price Index Highlights
The First American Data & Analytics’ Real House Price Index (RHPI) showed that in August 2025:
- Real house prices decreased 0.3 percent between August 2024 and August 2025.
- Real house prices decreased 1.5 percent between July 2025 and August 2025.
- Consumer house-buying power, how much one can buy based on changes in income and mortgage rates, increased 1.6 percent between July 2025 and August 2025, and increased 1.6 percent year over year.
- Median household income has increased 2.5 percent since August 2024 and 56.8 percent since January 2015.
- Real house prices are 31.8 percent more expensive than in January 2000.
- Unadjusted house prices are now 63.8 percent above the housing boom peak in 2006, while real, house-buying power-adjusted house prices are 7.6 percent below their 2006 housing boom peak.
August 2025 Real House Price State Highlights
- The five states with the greatest year-over-year increase in the RHPI are: South Dakota (+7.0 percent), Maine (+5.7 percent), New Hampshire (+5.0 percent), Wyoming (+4.6 percent), and Alaska (+4.5 percent).
- The five states with the greatest year-over-year decrease in the RHPI are: Florida (-10.3 percent), Nevada (-7.4 percent), Texas (-4.9 percent), Virginia (-4.9 percent), and Colorado (-4.5 percent).
August 2025 Real House Price Local Market Highlights
- Among the Core Based Statistical Areas (CBSAs) tracked by First American Data & Analytics, the five markets with the greatest year-over-year increase in the RHPI are: Cleveland (+7.2 percent), Hartford, Conn. (+7.0 percent), Cincinnati (+5.9 percent), Louisville, Ky. (+5.4 percent), and Milwaukee (+4.4 percent).
- Among the Core Based Statistical Areas (CBSAs) tracked by First American Data & Analytics, the five markets with the greatest year-over-year decrease in the RHPI are: Miami (-15.4 percent), Tampa, Fla. (-14.0 percent), Riverside, Calif. (-10.4 percent), Seattle (-10.1 percent), and Raleigh, N.C. (-9.2 percent).
Next Release
The next release of the First American Data & Analytics’ Real House Price Index will take place the week of November 24, 2025.
About the First American Data & Analytics’ Real House Price Index
The traditional perspective on house prices is fixated on the actual prices and the changes in those prices, which overlooks what matters to potential buyers - their purchasing power, or how much they can afford to buy. First American Data & Analytics’ proprietary Real House Price Index (RHPI) adjusts prices for purchasing power by considering how income levels and interest rates influence the amount one can borrow.
The RHPI uses a weighted repeat-sales house price index that measures the price movements of single-family residential properties by time and across geographies, adjusted for the influence of income and interest rate changes on consumer house-buying power. The index is set to equal 100 in January 2000. Changing incomes and interest rates either increase or decrease consumer house-buying power. When incomes rise and mortgage rates fall, consumer house-buying power increases, acting as a deflator of increases in the house price level. For example, if the house price index increases by three percent, but the combination of rising incomes and falling mortgage rates increase consumer buying power over the same period by two percent, then the Real House Price index only increases by 1 percent. The Real House Price Index reflects changes in house prices, but also accounts for changes in consumer house-buying power.
Disclaimer
Opinions, estimates, forecasts and other views contained in this page are those of First American’s Chief Economist, do not necessarily represent the views of First American or its management, should not be construed as indicating First American’s business prospects or expected results, and are subject to change without notice. Although the First American Economics team attempts to provide reliable, useful information, it does not guarantee that the information is accurate, current or suitable for any particular purpose. © 2025 by First American. Information from this page may be used with proper attribution.


