As the coronavirus outbreak continues to affect the domestic and global economy, the housing market has shown that it is not immune to its impact. In March, the number of existing-home sales fell 8.5 percent relative to February, and the number of new listings continued to dwindle. While mortgage rates have fallen due to the current economic uncertainty, stay-at-home orders have made it more difficult for potential home buyers to take advantage of the affordability boost, and first-time home buyers may have an even more difficult time as lenders have tightened credit availability. Despite all of the headwinds, homes continue to be bought and sold, but how will the changing dynamics of supply and demand impact house prices?
“Even as buyers and sellers pull back from the market and some sellers adjust their price expectations, transactions will continue to occur. The housing market may be down, but it may be better positioned than many believe.”
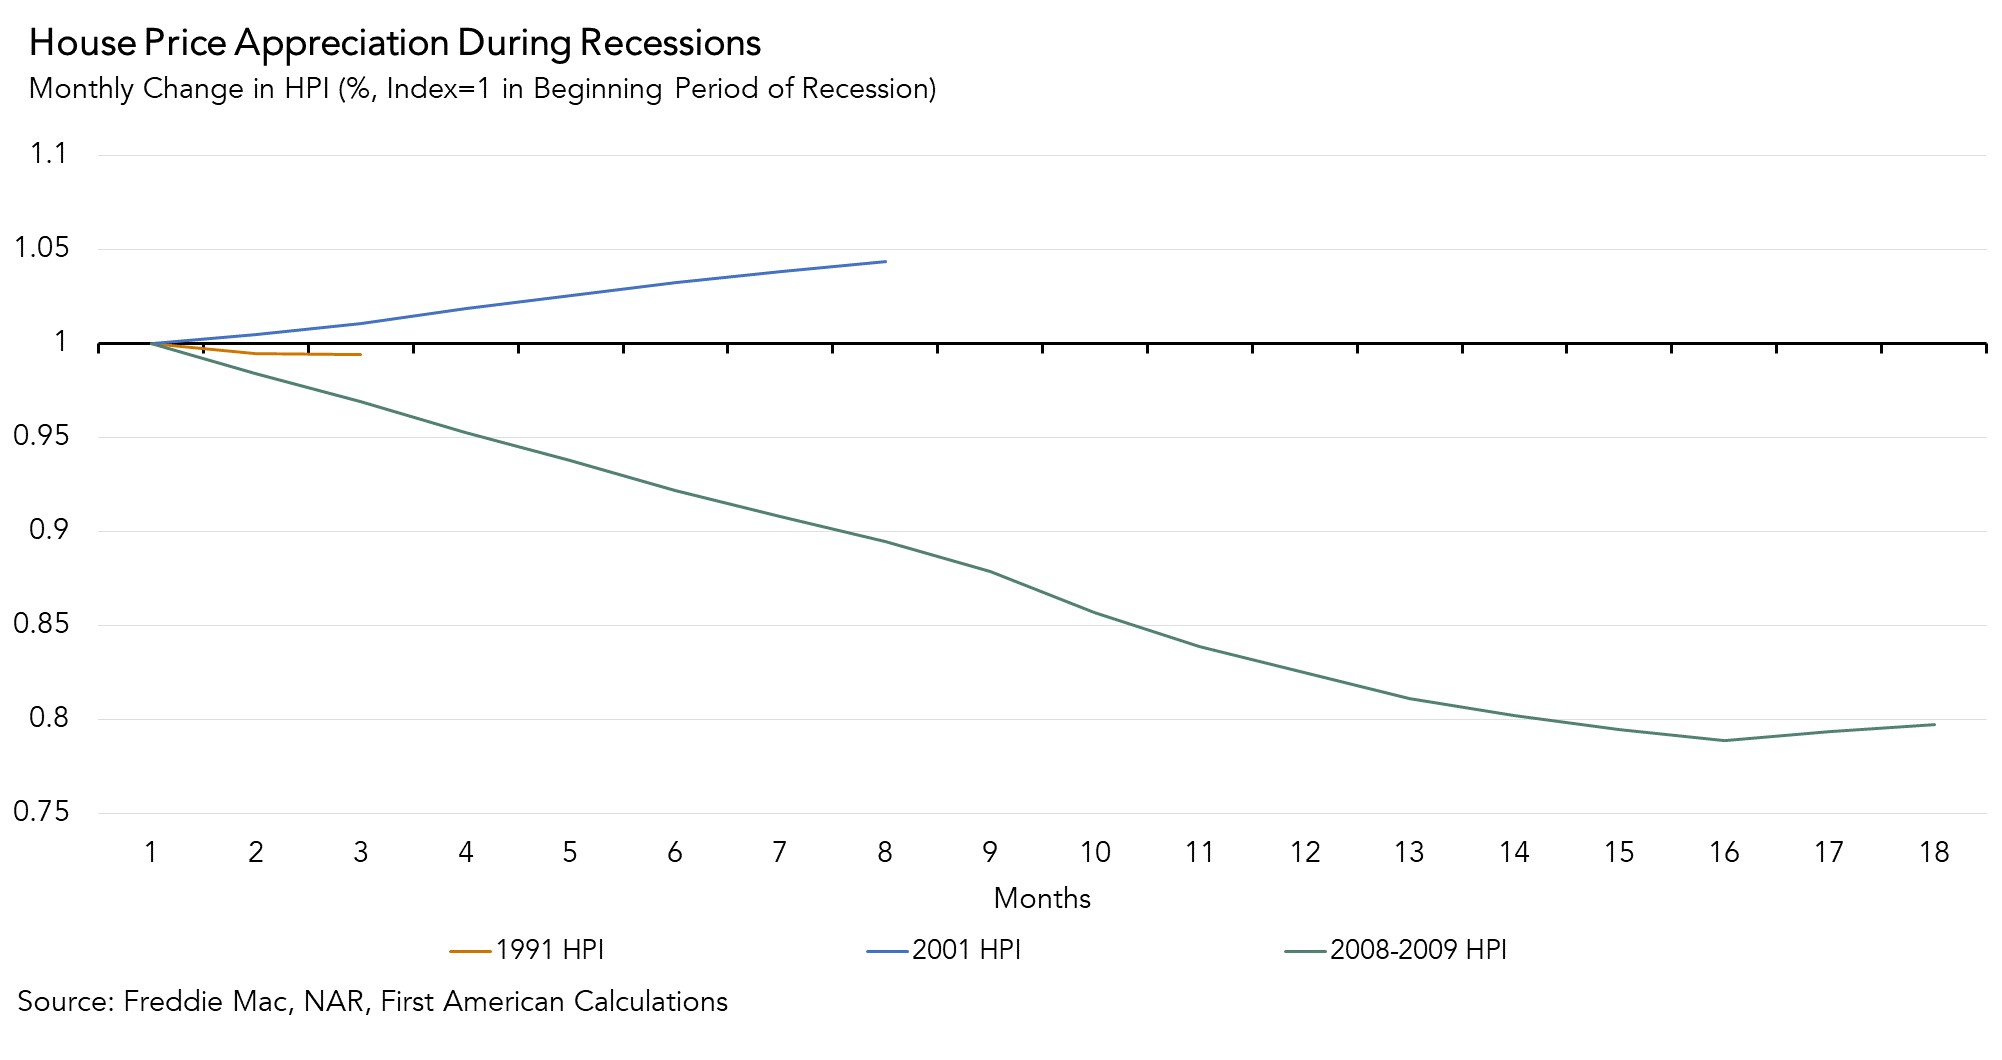
Why House Prices Tend to Be ‘Downside Sticky’ During Recessions
While every recession is different, we examined how the three most recent recessions impacted house prices for insight into how house prices may fare in the current environment. With the exception of the 2008-2009 recession, house prices have demonstrated their “downside stickiness,” zero or slow growth, but not much decline.
The “downside stickiness” of house prices is unique because typically aggregate demand shocks put a lot of downward pressure on the prices of goods and services, but in the housing market, sellers often withdraw supply rather than sell at lower prices. This dynamic played out in March, as the supply of homes for sale declined by 10.2 percent compared with one year ago. House prices declined in the 2008-2009 recession because homes were overvalued, mortgages were riskier and many homeowners had little equity, which resulted in a dramatic increase of foreclosures and distressed selling. Today’s housing market is fundamentally different.
Heading into 2020, record low inventory, combined with income and employment growth, tighter mortgage underwriting, and strong economic fundamentals, fueled price appreciation that was very different from the housing boom that peaked in 2006. House prices were rising before the pandemic because of a lack of supply of homes for sale, strong demand fueled by near record low mortgage rates and the robust underlying economic fundamentals of what was the longest expansion in U.S. history until March 2020.
What to Expect for the Spring Home-Buying Season?
As buyers and sellers pull back from the market and some sellers adjust their price expectations, it’s reasonable to expect a reduction in home sales and a moderation in house price appreciation in this year’s spring home-buying season. Yet, transactions will continue to occur. The housing market may be down, but it may be better positioned than many believe.
February 2020 Real House Price Index
In February 2020, a month before the coronavirus outbreak took hold in the U.S., the Real House Price Index (RHPI) confirmed the housing market’s surging momentum. Two of the three key drivers of the RHPI swung in favor of increased affordability in February. The labor market showed continued strength, as rising average hourly earnings resulted in a 2.7 percent yearly increase in household income. Additionally, compared with February 2019, the 30-year, fixed-rate mortgage fell by 0.9 percentage points. So, consumer house-buying power – how much one can buy based on changes in income and interest rates – continued to grow, boosting affordability and working offsetting the negative impact from rising house price appreciation.
For more analysis of affordability, please visit the Real House Price Index.
The RHPI is updated monthly with new data. Look for the next edition of the RHPI the week of May 25, 2020.
Sources:
February 2020 Real House Price Index Highlights
The First American Real House Price Index (RHPI) showed that in February 2020:
- Real house prices decreased 1.6 percent between January 2020 and February 2020.
- Real house prices declined 5.8 percent between February 2019 and February 2020.
- Consumer house-buying power, how much one can buy based on changes in income and interest rates, increased 2.5 percent between January 2020 and February 2020, and increased 14.6 percent year over year.
- Median household income has increased 2.7 percent since February 2019 and 60.0 percent since January 2000.
- Real house prices are 19.8 percent less expensive than in January 2000.
- While unadjusted house prices are now 10.3 percent above the housing boom peak in 2006, real, house-buying power-adjusted house prices remain 42.8 percent below their 2006 housing boom peak.
February 2020 Real House Price State Highlights
- The only state with a year-over-year increase in the RHPI is: New Jersey (+1.5 percent).
- The five states with the greatest year-over-year decrease in the RHPI are: Hawaii (-8.7 percent), New Mexico (-8.6 percent), Colorado (-8.5 percent), California (-8.2 percent), and Utah (-8.0 percent).
February 2020 Real House Price Local Market Highlights
- Among the Core Based Statistical Areas (CBSAs) tracked by First American, the two markets with a year-over-year increase in the RHPI are: Cleveland (+0.4 percent) and Milwaukee (+0.3 percent).
- Among the Core Based Statistical Areas (CBSAs) tracked by First American, the five markets with the greatest year-over-year decrease in the RHPI are: San Francisco (-10.8 percent), Denver (-9.5 percent), Las Vegas (-9.4 percent), Riverside, Calif. (-9.1 percent), and San Jose, Calif. (-8.9 percent).
About the First American Real House Price Index
The traditional perspective on house prices is fixated on the actual prices and the changes in those prices, which overlooks what matters to potential buyers - their purchasing power, or how much they can afford to buy. First American’s proprietary Real House Price Index (RHPI) adjusts prices for purchasing power by considering how income levels and interest rates influence the amount one can borrow.
The RHPI uses a weighted repeat-sales house price index that measures the price movements of single-family residential properties by time and across geographies, adjusted for the influence of income and interest rate changes on consumer house-buying power. The index is set to equal 100 in January 2000. Changing incomes and interest rates either increase or decrease consumer house-buying power. When incomes rise and mortgage rates fall, consumer house-buying power increases, acting as a deflator of increases in the house price level. For example, if the house price index increases by three percent, but the combination of rising incomes and falling mortgage rates increase consumer buying power over the same period by two percent, then the Real House Price index only increases by 1 percent. The Real House Price Index reflects changes in house prices, but also accounts for changes in consumer house-buying power.
Disclaimer
Opinions, estimates, forecasts and other views contained in this page are those of First American’s Chief Economist, do not necessarily represent the views of First American or its management, should not be construed as indicating First American’s business prospects or expected results, and are subject to change without notice. Although the First American Economics team attempts to provide reliable, useful information, it does not guarantee that the information is accurate, current or suitable for any particular purpose. © 2020 by First American. Information from this page may be used with proper attribution.


