As we are all too aware, the coronavirus outbreak has taken hold of the domestic and global economy. The housing market is not immune to its impact but may be in a better position than many believe. Recent data shows that weekly unemployment claims soared to a record, which will, in turn, work to depress household incomes and consumer confidence. While mortgage rates have fallen due to the economic uncertainty, potential home buyers that are confined to their homes cannot necessarily take advantage of the affordability boost. Many still bear scars from the Great Recession and may expect the housing market to follow a similar trajectory in response to the coronavirus outbreak. But, there are distinct differences that indicate the housing market may follow a much different path. While housing led the recession in 2008-2009, this time it may be poised to bring us out of it.
“This time, housing is a casualty of a public health crisis turned economic, not the cause of an economic crisis.”
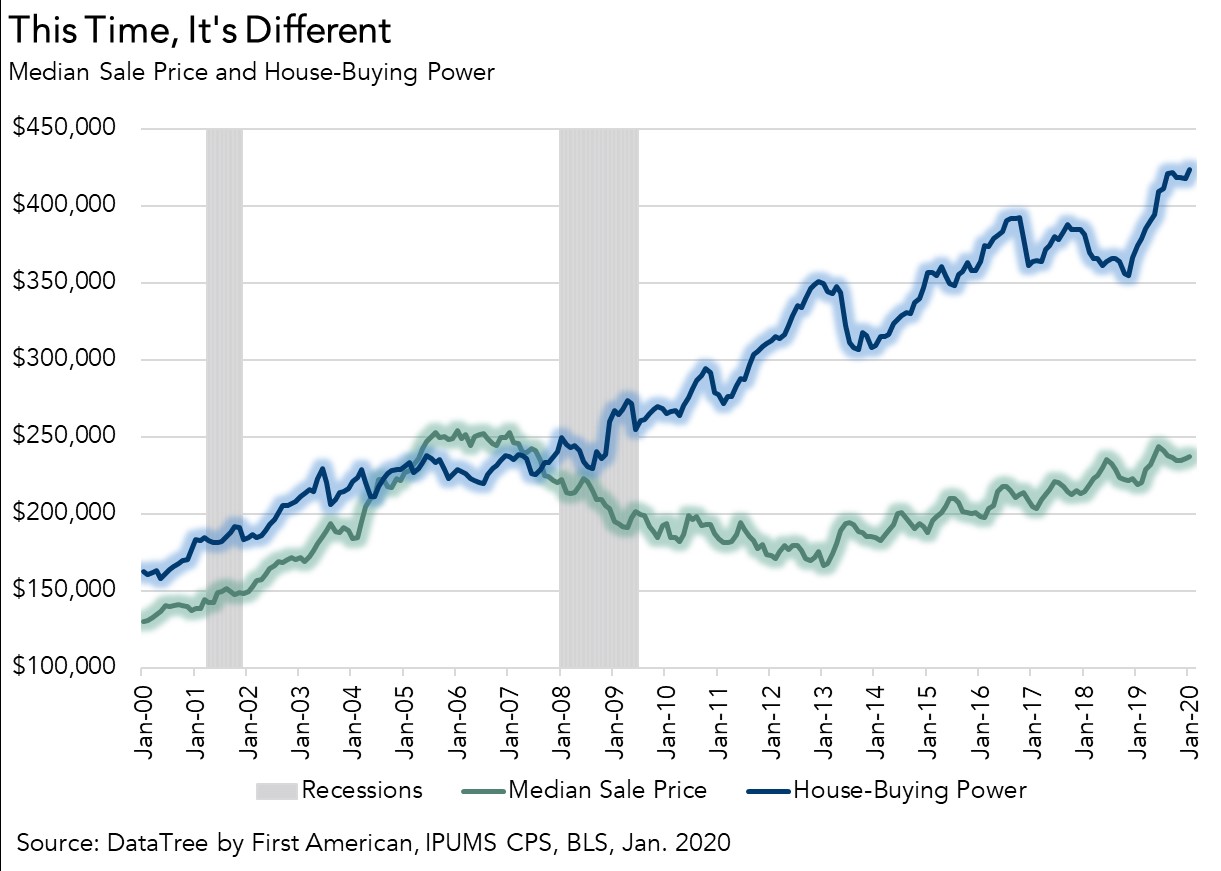
The Housing Market Then Versus Now
Let’s examine several differences between the pre-Great Recession housing market and the housing market at the cusp of the coronavirus outbreak.
- Housing Market is Not Overvalued: The graphic below compares house-buying power and the median sale price of a home from the year 2000 through January 2020. If housing is appropriately valued, house-buying power should equal or outpace the median sale price of a home. The only time period when the median sale price was greater than house-buying power was from 2005 through 2007, indicating an overvaluation of housing, or a “housing bubble.” Today, house-buying power is nearly twice as high as the median sale price of home, implying that housing is not overvalued, and is in fact in a much better position entering this potential recession than it was ahead of the last.
- The Housing Market is Underbuilt: Housing enters this potential recession underbuilt rather than overbuilt, a significant difference compared with the pre-Great Recession housing market. In fact, since 2009, housing demand has outstripped housing supply. In 2018 – the latest full year for which we have comprehensive data – 1.2 million households were formed, while only 860,000 units were produced, resulting in a shortage of 340,000 units. Prior to 2009, the opposite was true, as housing supply significantly outpaced demand. The limited supply of homes positions the housing market to lead the recovery, once the impact from the coronavirus outbreak fades. In fact, it’s important to remember that the housing market has traditionally aided the economy in recovering from a recession. Consumers who are less affected by a downturn are willing to buy and sell, which can help get other parts of the economy moving.
- Equity is at Historical Highs: The housing market today is not driven by liberal lending standards, sub-prime mortgages, and highly leveraged homeowners, as shown by the fact that the household debt-to-income ratio is at a four-decade low. The housing crisis during the Great Recession was fueled heavily by the fact that job losses were paired with a significant share of homeowners who had little, if any, equity in their homes. Homeowners today have very high levels of tappable home equity, providing a cushion to withstand potential price declines.
What’s the Prognosis for Housing?
Unfortunately, the service industry – hospitality, retail and leisure specifically – will likely feel the sharpest and most immediate economic pain from the coronavirus outbreak. There are over 130 million workers in the overall service sector, which accounts for 86 percent of total nonfarm employment, so job losses are expected to be high in this labor-intensive sector. Of course, the housing market will not go unscathed, as consumer confidence and a strong labor market are essential in the decision to purchase a home. Yet, this time, housing is a casualty of a public health crisis turned economic, not the cause of an economic crisis.
January 2020 Real House Price Index
In January 2020, more than a month before the coronavirus outbreak took hold in the U.S., the Real House Price Index (RHPI) confirmed the housing market’s surging momentum. Two of the three key drivers of the RHPI swung in favor of increased affordability in January. The labor market showed continued strength, as rising average hourly earnings resulted in a 2.3 percent yearly increase in household income. Additionally, compared with January 2019, the 30-year, fixed-rate mortgage fell by 0.8 percentage points. So, consumer house-buying power – how much one can buy based on changes in income and interest rates – continued to grow, boosting affordability and working offsetting the negative impact from rising house price appreciation.
For more analysis of affordability, please visit the Real House Price Index.
The RHPI is updated monthly with new data. Look for the next edition of the RHPI the week of April 27, 2020.
Sources:
January 2020 Real House Price Index Highlights
The First American Real House Price Index (RHPI) showed that in January 2020:
- Real house prices increased 0.1 percent between December 2019 and January 2020.
- Real house prices declined 3.8 percent between January 2019 and January 2020.
- Consumer house-buying power, how much one can buy based on changes in income and interest rates, increased 1.4 percent between December 2019 and January 2020, and increased 13.2 percent year over year.
- Median household income has increased 2.3 percent since January 2019 and 59.0 percent since January 2000.
- Real house prices are 17.2 percent less expensive than in January 2000.
- While unadjusted house prices are now 10.9 percent above the housing boom peak in 2006, real, house-buying power-adjusted house prices remain 41.0 percent below their 2006 housing boom peak.
January 2020 Real House Price State Highlights
- The only two states with a year-over-year increase in the RHPI are: New Jersey (+2.7 percent) and Ohio (+0.2 percent).
- The five states with the greatest year-over-year decrease in the RHPI are: Utah (-7.5 percent), New Mexico (-7.2 percent), Colorado (-7.2 percent), California (-6.7 percent), and Mississippi (-6.7 percent).
January 2020 Real House Price Local Market Highlights
- Among the Core Based Statistical Areas (CBSAs) tracked by First American, the four markets with a year-over-year increase in the RHPI are: Cleveland (+3.5 percent), Milwaukee (+1.4 percent), Cincinnati (+0.8 percent), and Philadelphia (+0.3 percent).
- Among the Core Based Statistical Areas (CBSAs) tracked by First American, the five markets with the greatest year-over-year decrease in the RHPI are: San Francisco (-8.4 percent), Boston (-8.2 percent), Denver (-8.1 percent), Portland, Ore. (-7.9 percent), and Riverside, Calif. (-7.6 percent).
About the First American Real House Price Index
The traditional perspective on house prices is fixated on the actual prices and the changes in those prices, which overlooks what matters to potential buyers - their purchasing power, or how much they can afford to buy. First American’s proprietary Real House Price Index (RHPI) adjusts prices for purchasing power by considering how income levels and interest rates influence the amount one can borrow.
The RHPI uses a weighted repeat-sales house price index that measures the price movements of single-family residential properties by time and across geographies, adjusted for the influence of income and interest rate changes on consumer house-buying power. The index is set to equal 100 in January 2000. Changing incomes and interest rates either increase or decrease consumer house-buying power. When incomes rise and mortgage rates fall, consumer house-buying power increases, acting as a deflator of increases in the house price level. For example, if the house price index increases by three percent, but the combination of rising incomes and falling mortgage rates increase consumer buying power over the same period by two percent, then the Real House Price index only increases by 1 percent. The Real House Price Index reflects changes in house prices, but also accounts for changes in consumer house-buying power.
Disclaimer
Opinions, estimates, forecasts and other views contained in this page are those of First American’s Chief Economist, do not necessarily represent the views of First American or its management, should not be construed as indicating First American’s business prospects or expected results, and are subject to change without notice. Although the First American Economics team attempts to provide reliable, useful information, it does not guarantee that the information is accurate, current or suitable for any particular purpose. © 2020 by First American. Information from this page may be used with proper attribution.


