The coronavirus pandemic continues to take hold of the domestic and global economy. The housing market, although in a better position than it was at the onset of the last recession, will not be immune to the impact. Weekly unemployment claims have soared to record highs, which has already contributed to declining consumer confidence.
The pandemic’s impacts have also influenced our Potential Home Sales Model. Market potential fell in March, as lenders tightened credit due to concern that many economically impacted households will not be able to make their mortgage payments. In March, the market potential for existing-home sales dropped to its lowest level since February 2016, according to our Potential Home Sales Model. Housing market potential decreased 9.0 percent in March relative to the previous month, and fell 7.5 percent year over year, a decline of nearly of 400,000 potential existing-home sales.
“The immediate impact of the coronavirus pandemic on the housing market will be a reduction in spring sales activity and a moderation of price appreciation.”
Credit Tightens, Potential Falls
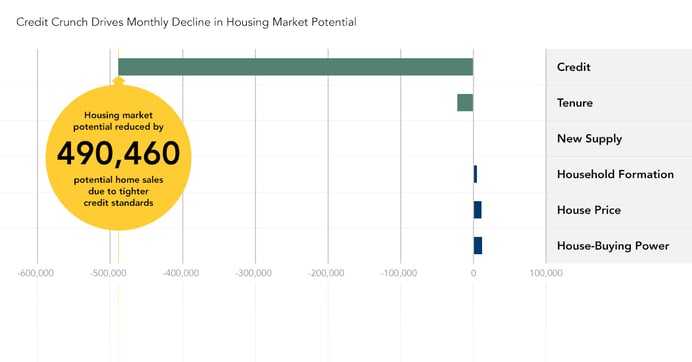
In March, tightening credit had by far the largest month-over-month negative impact on the market potential for home sales, followed distantly by rising tenure length. When lending standards tighten, fewer people can qualify for a mortgage to buy a home. When homeowners are less likely to qualify for a mortgage for a new home or qualify for a low mortgage rate, they are more likely to stay in their current home. Additionally, many potential first-time home buyers no longer qualify for a mortgage when credit tightens. So, tighter lending standards reduce demand and, in turn, housing market potential. To measure credit, we use the Chicago Fed’s National Financial Conditions Index (NFCI), specifically the credit sub index. In March, the index jumped relative to one month ago, indicating tighter credit standards, and thus reducing housing market potential by 490,460 potential home sales.
Why did credit tighten? In the current economic environment, rising jobless claims and a rising unemployment rate indicate a higher risk of mortgage delinquencies. Lenders are tightening their credit criteria to account for a higher likelihood of forbearance and delinquency. In fact, just days ago, JPMorgan Chase announced that it would be raising its minimum credit score to 700 on all new mortgages, and that new borrowers will need at least a 20 percent down payment to qualify – a significant credit hurdle for first-time home buyers. While they are the first bank to make the change, they are not expected to be the last.
What to Expect Looking Ahead
Tightening credit is already impacting the housing market and rising tenure length remains a headwind as well, but what can we expect of the other drivers of market potential for existing-home sales? In March, house-buying power continued to increase relative to one month ago, as mortgage rates remained low and household income data has yet to be impacted by the current environment.
While income growth may slow, we expect mortgage rates to remain low. Even with a continued boost in house-buying power, tighter lending standards will make it harder for some borrowers to leverage the market’s low mortgage rates. The contraction in credit availability reduces demand. However, housing supply remains at historically low levels, so house price growth is likely to slow, but it’s unlikely to go negative, as house prices are “downside sticky.” The result? The immediate impact of the coronavirus pandemic on the housing market will be a reduction in spring sales activity and a moderation of price appreciation.
March 2020 Potential Home Sales
For the month of March, First American updated its proprietary Potential Home Sales Model to show that:
- Potential existing-home sales decreased to a 4.94 million seasonally adjusted annualized rate (SAAR), a 9.0 percent month-over-month decrease.
- This represents a 47.1 percent increase from the market potential low point reached in February 1993.
- The market potential for existing-home sales decreased 7.5 percent compared with a year ago, a loss of nearly 400,000 (SAAR) sales.
- Currently, potential existing-home sales is 1.8 million (SAAR), or 26.6 percent below the pre-recession peak of market potential, which occurred in March 2004.
Market Performance Gap
- The market for existing-home sales outperformed its potential by 13.7 percent or an estimated 678,500 (SAAR) sales.
- The market performance gap increased by an estimated 565,800 (SAAR) sales between February 2020 and March 2020.
First American Deputy Chief Economist Odeta Kushi contributed to this post.
What Insight Does the Potential Home Sales Model Reveal?
When considering the right time to buy or sell a home, an important factor in the decision should be the market’s overall health, which is largely a function of supply and demand. Knowing how close the market is to a healthy level of activity can help consumers determine if it is a good time to buy or sell, and what might happen to the market in the future. That is difficult to assess when looking at the number of homes sold at a particular point in time without understanding the health of the market at that time. Historical context is critically important. Our potential home sales model measures what we believe a healthy market level of home sales should be based on the economic, demographic and housing market environments.
About the Potential Home Sales Model
Potential home sales measures existing-homes sales, which include single-family homes, townhomes, condominiums and co-ops on a seasonally adjusted annualized rate based on the historical relationship between existing-home sales and U.S. population demographic data, homeowner tenure, house-buying power in the U.S. economy, price trends in the U.S. housing market, and conditions in the financial market. When the actual level of existing-home sales are significantly above potential home sales, the pace of turnover is not supported by market fundamentals and there is an increased likelihood of a market correction. Conversely, seasonally adjusted, annualized rates of actual existing-home sales below the level of potential existing-home sales indicate market turnover is underperforming the rate fundamentally supported by the current conditions. Actual seasonally adjusted annualized existing-home sales may exceed or fall short of the potential rate of sales for a variety of reasons, including non-traditional market conditions, policy constraints and market participant behavior. Recent potential home sale estimates are subject to revision to reflect the most up-to-date information available on the economy, housing market and financial conditions. The Potential Home Sales model is published prior to the National Association of Realtors’ Existing-Home Sales report each month.


