
Key Points:
- Affordability improved in March, aided by falling mortgage rates, slower house price growth, and rising household income.
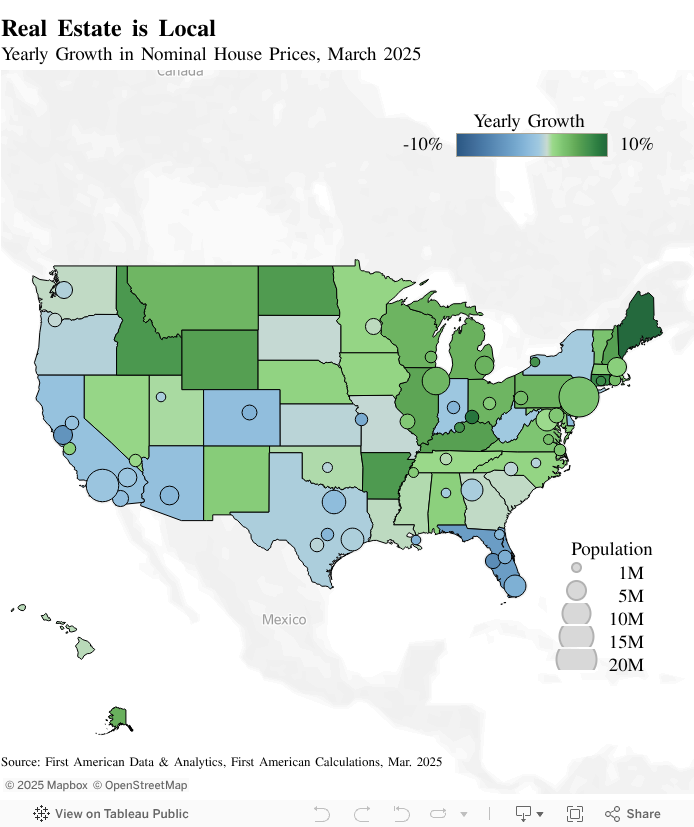
- National house price growth remains modestly positive, but prices declined in 13 of the top 50 markets year over year, while other markets posted strong gains.
- Market divergence in house price trends is below historical averages, but the differences reinforce that affordability trends can vary significantly across markets.
Home buyers received some welcome news in March as mortgage rates fell and affordability improved by 2.4 percent over February, according to the Real House Price Index (RHPI). Annually, affordability improved by 3.2 percent. Mortgage rates in March were 17 basis points lower than one year ago, and national house price appreciation slowed to 2.3 percent. The final component of affordability—household income growth—also contributed to the improvement, as incomes continued to rise.
National home price growth remains positive, but just barely, hovering in the low single digits. However, the national average masks significant regional variation. Modest national price growth often reflects a mix of declining prices in some markets alongside rising prices in others. This divergence matters for affordability because home prices, along with income and mortgage rates, form the foundation of housing affordability. With mortgage rates still elevated and flattening—or even falling—prices in some markets, home buyers may find themselves in a stronger negotiating position than just a few months ago.
“National home values conceal regional nuance, and in today’s market, knowing where to buy may matter more than when to buy.”
Mind the Gap Between the High and Low Markets
House prices sit at the intersection of supply and demand. When demand exceeds supply, prices rise. When supply overshoots demand, prices may fall as sellers compete for buyers. As of March, house prices declined in 13 of the top 50 metro markets compared with a year ago. Notably, six of those 13 markets are in Texas or Florida—two regions that saw rapid pandemic-era expansion. Prices declined the most in Tampa, Fla. in March, falling by nearly 5 percent year over year, with the decline driven by a combination of persistent high mortgage rates, cooling demand, and rising inventory.
At the other end of the spectrum, Cincinnati led the country with over 9 percent annual price growth. Tight inventory in a relatively affordable market continues to support strong price gains in this market. These two examples highlight a diverging housing landscape, where market fundamentals are pulling prices in different directions across regions.
Is Real Estate More Local Than Ever?
To assess how geographically fragmented the housing market has become, we calculated the monthly gap between the highest and lowest annual house price growth rates among the top 50 markets from 1992 through March 2025. Crucially, we focus only on months where at least one market experienced price declines while another saw gains—periods of true directional divergence.
Surprisingly, the current level of dispersion is not historically extreme. In fact, house price growth divergence peaked during the housing boom of 2004, when Las Vegas surged by 46.5 percent year over year, while Pittsburgh declined by 4.6 percent—a spread of over 51 percentage points. Over the full historical period, the average divergence between the strongest and weakest markets was just over 21 percentage points. In March 2025, the difference is 14 percentage points, below average, and far from unprecedented.

Why Does House Regional Price Variation Matter?
The housing market today isn’t marked by record-level regional divergence, but the variation is still meaningful. While national home price growth remains modest, beneath the surface, some markets are softening and others continue to appreciate. That divergence has direct implications for affordability. In high-growth markets, home buyers face a double bind: sticky mortgage rates and rising prices. But, in cooling markets, flat or even falling prices can offer modest relief, helping improve affordability, even in the face of elevated rates.
National home values conceal regional nuance, and in today’s market, knowing where to buy may matter more than when to buy. The takeaway isn’t that real estate has become more local than ever, it’s that national trends only tell part of the story, and the real insight comes from watching how individual markets respond differently to the same macro-economic pressures.
Sources:
• First American Data & Analytics
• Freddie Mac
• Census Bureau
March 2025 Real House Price Index Highlights
The First American Data & Analytics’ Real House Price Index (RHPI) showed that in March 2025:
- Real house prices decreased 3.2 percent between March 2024 and March 2025.
- Real house prices decreased 2.4 percent between February 2025 and March 2025.
- Consumer house-buying power, how much one can buy based on changes in income and mortgage rates, increased 2.4 percent between February 2025 and March 2025, and increased 5.6 percent year over year.
- Median household income has increased 3.8 percent since March 2024 and 56.4 percent since January 2015.
- Real house prices are 32.7 percent more expensive than in January 2000.
- Unadjusted house prices are now 63.3 percent above the housing boom peak in 2006, while real, house-buying power-adjusted house prices are 7.0 percent below their 2006 housing boom peak.
March 2025 Real House Price State Highlights
- The five states with the greatest year-over-year increase in the RHPI are: Maine (+7.5 percent), New Hampshire (+3.4 percent), North Dakota (+3.4 percent), Rhode Island (+3.0 percent), and Connecticut (+1.6 percent).
- The five states with the greatest year-over-year decrease in the RHPI are: Florida (-10.9 percent), Colorado (-9.0 percent), Texas (-8.5 percent), Mississippi (-7.6 percent), and Indiana (-7.4 percent).
March 2025 Real House Price Local Market Highlights
- Among the Core Based Statistical Areas (CBSAs) tracked by First American Data & Analytics, the five markets with the greatest year-over-year increase in the RHPI are: Louisville, Ky. (+5.8 percent), Cincinnati (+5.6 percent), Hartford, Conn. (+3.5 percent), Buffalo, N.Y. (+2.9 percent), and Milwaukee (+2.3 percent).
- Among the Core Based Statistical Areas (CBSAs) tracked by First American Data & Analytics, the five markets with the greatest year-over-year decrease in the RHPI are: Tampa, Fla. (-17.7 percent), Seattle (-12.4 percent), Orlando, Fla. (-12.0 percent), San Francisco (-11.5 percent), and Atlanta (-11.5 percent).
Next Release
The next release of the First American Data & Analytics’ Real House Price Index will take place the week of June 23, 2025.
About the First American Data & Analytics’ Real House Price Index
The traditional perspective on house prices is fixated on the actual prices and the changes in those prices, which overlooks what matters to potential buyers - their purchasing power, or how much they can afford to buy. First American Data & Analytics’ proprietary Real House Price Index (RHPI) adjusts prices for purchasing power by considering how income levels and interest rates influence the amount one can borrow.
The RHPI uses a weighted repeat-sales house price index that measures the price movements of single-family residential properties by time and across geographies, adjusted for the influence of income and interest rate changes on consumer house-buying power. The index is set to equal 100 in January 2000. Changing incomes and interest rates either increase or decrease consumer house-buying power. When incomes rise and mortgage rates fall, consumer house-buying power increases, acting as a deflator of increases in the house price level. For example, if the house price index increases by three percent, but the combination of rising incomes and falling mortgage rates increase consumer buying power over the same period by two percent, then the Real House Price index only increases by 1 percent. The Real House Price Index reflects changes in house prices, but also accounts for changes in consumer house-buying power.
Disclaimer
Opinions, estimates, forecasts and other views contained in this page are those of First American’s Chief Economist, do not necessarily represent the views of First American or its management, should not be construed as indicating First American’s business prospects or expected results, and are subject to change without notice. Although the First American Economics team attempts to provide reliable, useful information, it does not guarantee that the information is accurate, current or suitable for any particular purpose. © 2025 by First American. Information from this page may be used with proper attribution.


