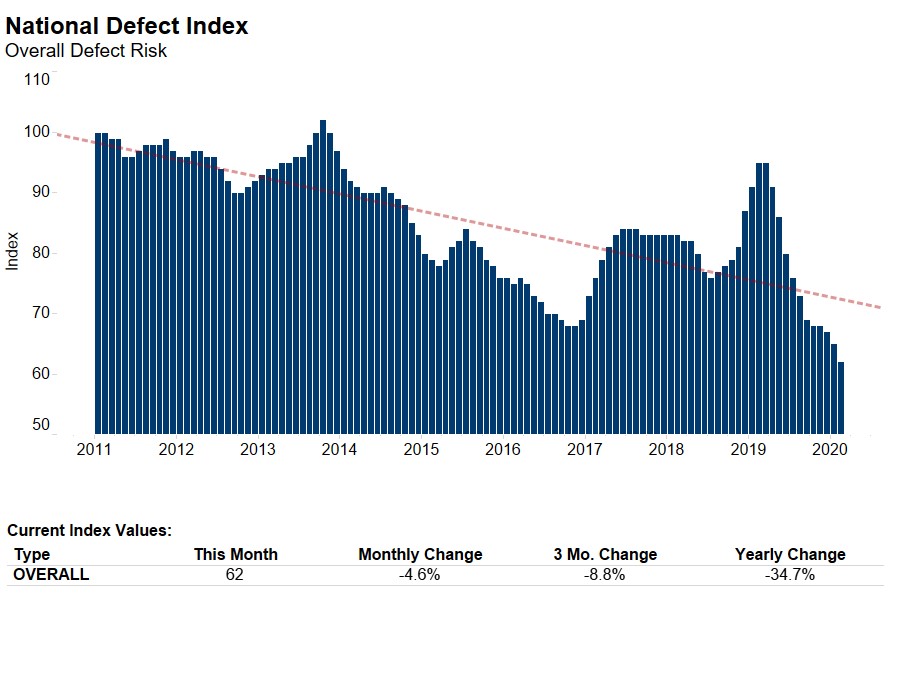
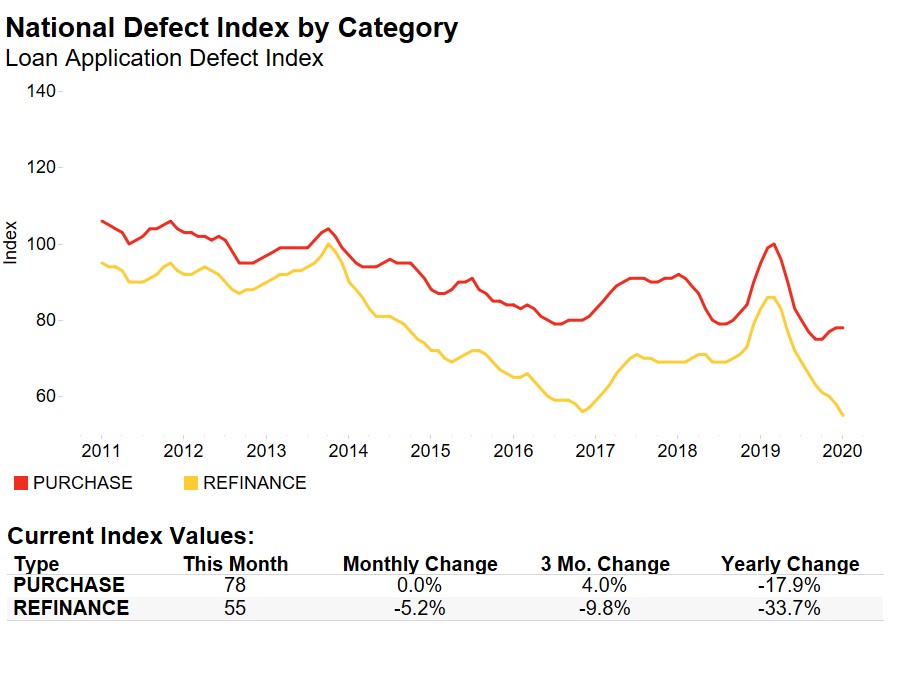
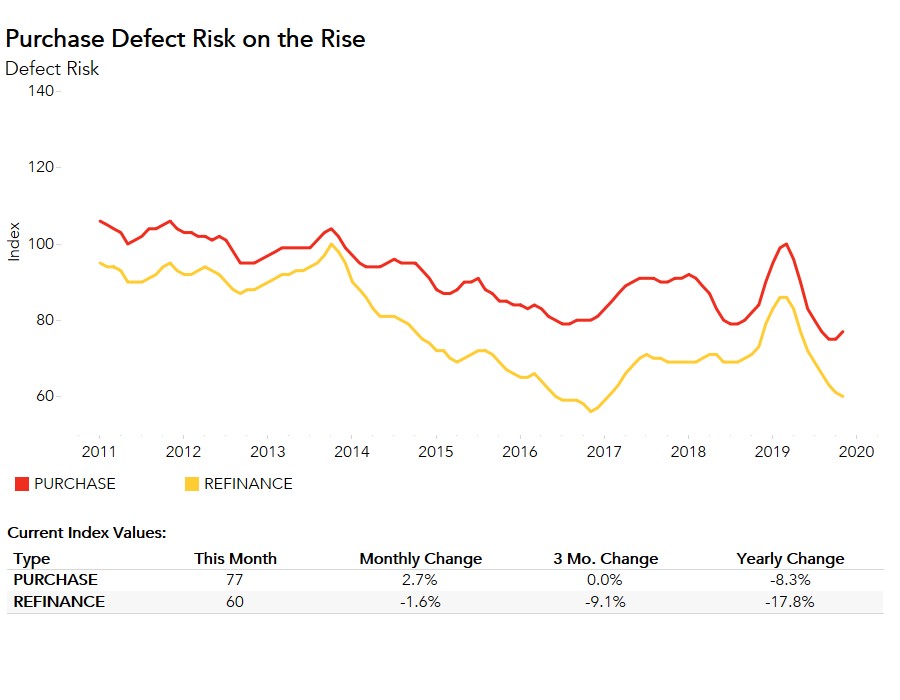
As we predicted last month, the Loan Application Defect Index for purchase transactions reached a turning point in November. After falling since March, the Defect Index for purchase transactions increased 2.7 percent compared with October, while the Defect Index for refinance transactions fell by 1.6 percent, its eighth straight month of declining risk. The overall Defect Index, which includes both purchase and refinance transactions, remained the same compared with last month, and is 16.0 percent lower than one year ago.
"The direction of defect risk in 2020 is in large part dependent on mortgage rates and how many homeowners that are 'in the money' choose to refinance."
Overall defect risk has been declining since March of this year, and November marks a pause to this trend. The reason for the change is two-fold:
- House-Buying Power Appreciation Slows: When house-buying power – i.e. how much home one can buy based on changes in household income and interest rates – falls in a supply-constrained market fraud risk may increase. Potential home buyers feel more confident and less inclined to commit fraud when they are in a better financial position to purchase a home. While house-buying power remains high, the pace of growth slowed beginning in October, when mortgage rates began to inch up. In 2019, the average monthly growth rate of house-buying power through September was 1.6 percent. Over the two months of October and November combined, house-buying power declined 0.6 percent relative to September. The slowdown in house-buying power appreciation lessens the confidence of home buyers, so they may be more inclined to misrepresent information on a loan application, leading to an increase in the defect index for purchase transactions.
- Market Composition Shift: In November, the volume of mortgage applications dipped 2.2 percent relative to one year ago, mostly driven by the 8 percent decline in refinancing activity. Purchase activity, however, increased 7 percent relative to one year ago. Defect, fraud and misrepresentation risk is significantly lower on refinance transactions, so the increased share of higher-risk purchase activity halted the decline in the overall defect index.
Mortgage Rates, Refi Volume to Drive Defect Risk Trend in 2020
Slightly higher mortgage rates through the end of the year may result in a small dip in house-buying power and a further pullback in refinance demand. But, looking ahead to 2020, mortgage rates are expected to remain below 4 percent. At that level, there are still 6.8 million borrowers today who could benefit financially by refinancing to a lower mortgage rate. As a result, the direction of defect risk in 2020 is in large part dependent on mortgage rates and how many homeowners that are “in the money” choose to refinance.
For Mark’s full analysis on loan defect risk, the top five states and markets with the greatest increases and decreases in defect risk, and more, please visit the Loan Application Defect Index.
The Defect Index is updated monthly with new data. Look for the next edition of the Defect Index the week of January 27, 2020.
November 2019 Loan Application Defect Index
The First American Loan Application Defect Index showed that in November 2019:
- The frequency of defects, fraudulence and misrepresentation in the information submitted in mortgage loan applications remained the same as the previous month.
- Compared with November 2018, the Defect Index decreased by 16.0 percent.
- The Defect Index is down 33.3 percent from the high point of risk in October 2013.
- The Defect Index for refinance transactions decreased by 1.6 percent compared with previous month, and decreased by 17.8 percent compared with a year ago.
- The Defect Index for purchase transactions increased by 2.7 percent compared with the previous month, and is down 8.3 percent compared with a year ago.
November 2019 State Highlights
- There is no state with a year-over-year increase in defect frequency.
- The five states with the greatest year-over-year decrease in defect frequency are: Alaska (-34.8 percent), West Virginia (-31.8 percent), North Carolina (-27.0 percent), Virginia (-26.4 percent), Indiana (-24.1 percent).
November 2019 Local Market Highlights
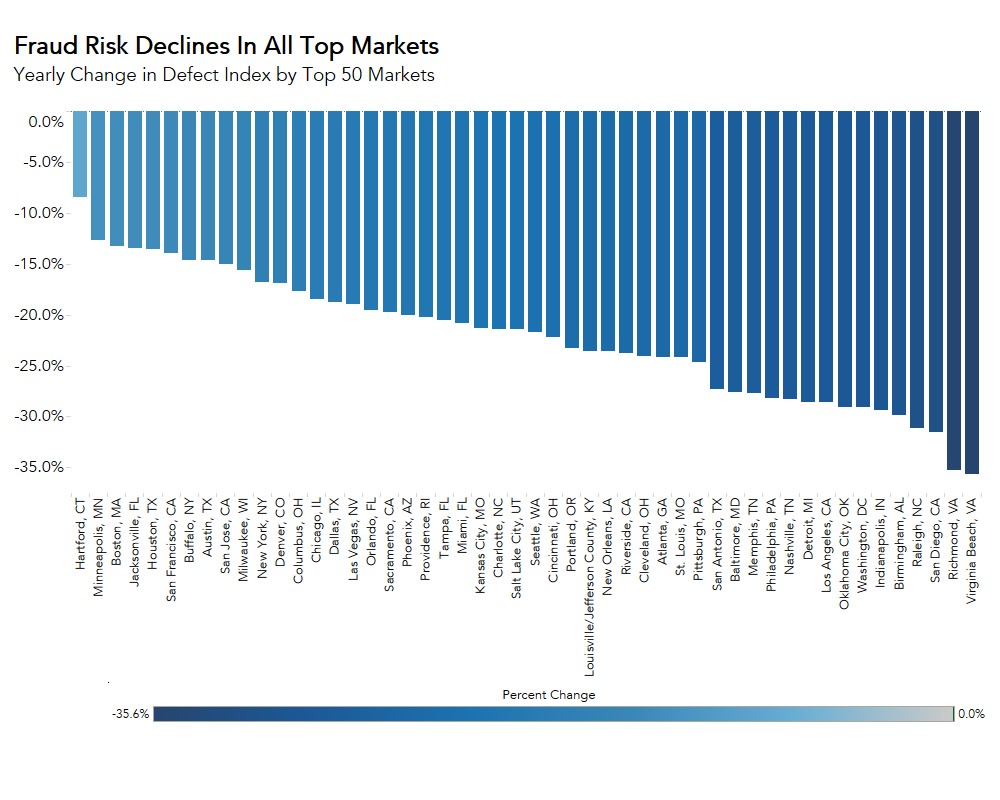
- Among the largest 50 Core Based Statistical Areas (CBSAs), there is no market with the year-over-year increase in defect frequency.
- Among the largest 50 Core Based Statistical Areas (CBSAs), the five markets with the greatest year-over-year decrease in defect frequency are: Richmond, Va. (-30.9 percent), Virginia Beach, Va. (-30.2 percent), Oklahoma City (-27.2 percent), Raleigh, N.C. (-27.1 percent), and San Diego (-27.0 percent).
Methodology
The First American Loan Application Defect Index estimates the level of defects detected in the information submitted in mortgage loan applications processed by the First American FraudGuard® system. The index is based on the frequency with which defect indicators are identified. The Defect Index moves higher as greater numbers of defect indicators are identified. An increase in the index indicates a rising level of loan application defects. The index, nationally and in all markets, is benchmarked to a value of 100 in January 2011. Therefore, all index values can be interpreted as the percentage change in defect frequency relative to the defect frequency identified nationally in January 2011.