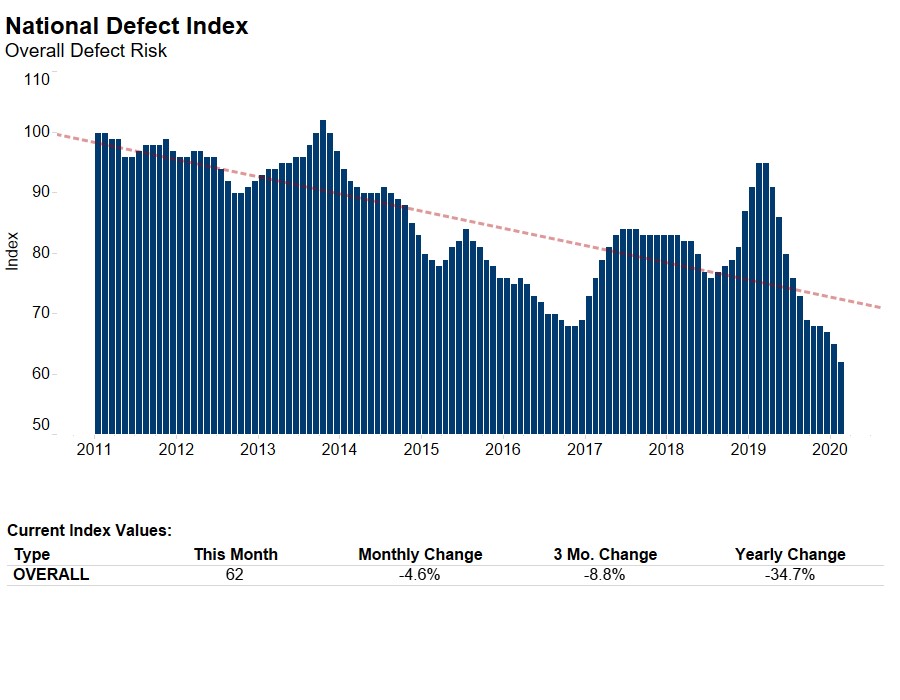
A historical view of overall defect risk, as measured by our Loan Application Defect Index, shows a long-run downward trend since we began tracking defect risk in 2011, with a few exceptions. In February 2020, this long-run trend continued as overall defect risk reached its lowest level in index history. The Defect Index for purchase transactions fell by 2.6 percent compared with the previous month, while the Defect Index for refinance transactions fell by 5.5 percent, pulling the overall defect risk level to this new low point. While various dynamics drive fraud risk in the short run, there are two forces that have consistently reduced fraud risk over approximately the last 10 years: policy and technology innovation.
"Today’s housing market benefits from new technology and policy guardrails against fraud and defect risk, innovations that will serve the industry well in the uncertain days ahead."
The Ability-to-Repay Saves the Day
In January of 2013, the Consumer Finance Protection Bureau (CFPB) published new requirements for mortgage lenders to carefully assess a consumer’s ability to repay their mortgage loan. The new “ability-to-repay” rules were implemented one year later in January 2014. This marked the beginning of a new income-underwriting era. The “ability-to-repay” rules discouraged the use of high-risk loan products that were common during the housing boom. Instead, mortgage lenders are required to make a reasonable and good faith determination of the consumer’s ability to repay. To meet the new “ability-to-repay” standard, mortgage lenders standardized the mortgage loan manufacturing and underwriting practices associated with the determination of a consumer’s ability to repay. But, what impact did the ability-to-repay rules have on loan application defect, fraud and misrepresentation risk?
Our income-specific metric within the Defect Index reached its peak in December 2012, one month before the rules were issued. By December 2013, one year later, the income-specific defect risk metric had declined 33 percent, as lenders implemented new loan manufacturing and underwriting practices in preparation for the effective start of the rule in January 2014. Since then, income-specific defect and fraud risk has continued to decline and is currently 60 percent below its peak prior to publication of the ability-to-repay rules.
Data-Driven Innovation, Automation
The mortgage finance industry’s significant investment in financial technology is the other major driver of the long-run decline in fraud risk. For example, advancements in mortgage technology allow lenders to compare a borrower’s information against employment databases and other data sources, and algorithms can inspect whether recent bank account deposits are consistent with a borrower’s paystubs. Technology can also be used to flag missing or inconsistent data. These advancements, which help to deliver a convenient, digital, highly automated and all-around better home-buying experience, have also enhanced the mortgage manufacturing and underwriting process, producing declining levels of defect risk.
There’s a lot of uncertainty in the economy and mortgage markets these days. While fraud risk will never be zero, it is certainly in a better place today than it was nearly a decade ago. Today’s housing market benefits from new technology and policy guardrails against fraud and defect risk, innovations that will serve the industry well in the uncertain days ahead.
The Defect Index is updated monthly with new data. Look for the next edition of the Defect Index the week of April 27, 2020.
February 2020 Loan Application Defect Index
The First American Loan Application Defect Index showed that in February 2020:
- The frequency of defects, fraudulence and misrepresentation in the information submitted in mortgage loan applications decreased by 4.6 percent compared with the previous month.
- Compared to February 2019, the Defect Index decreased by 34.7 percent.
- The Defect Index is down 39.2 percent from the high point of risk in October 2013.
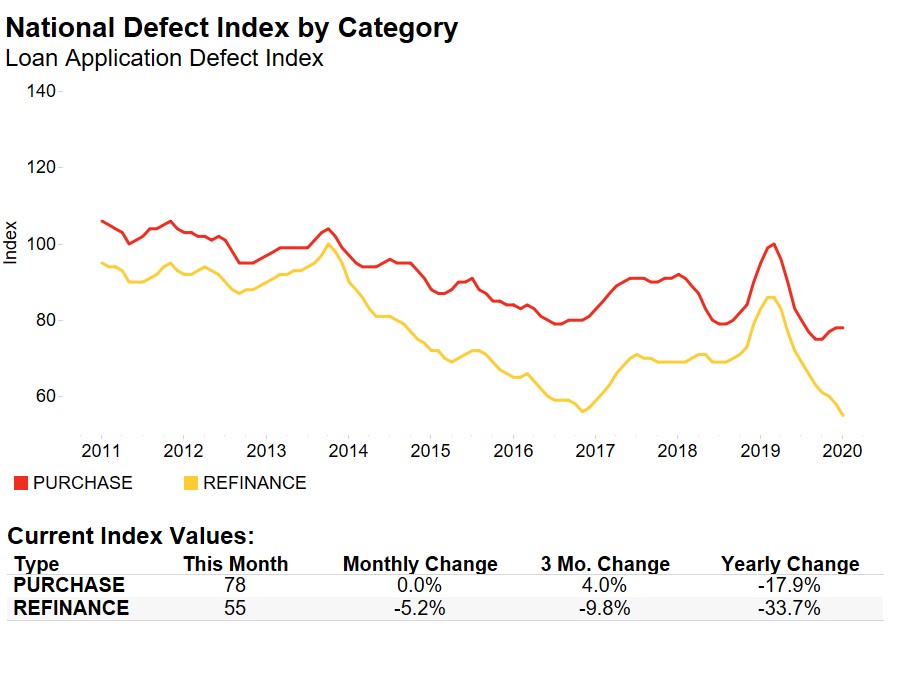
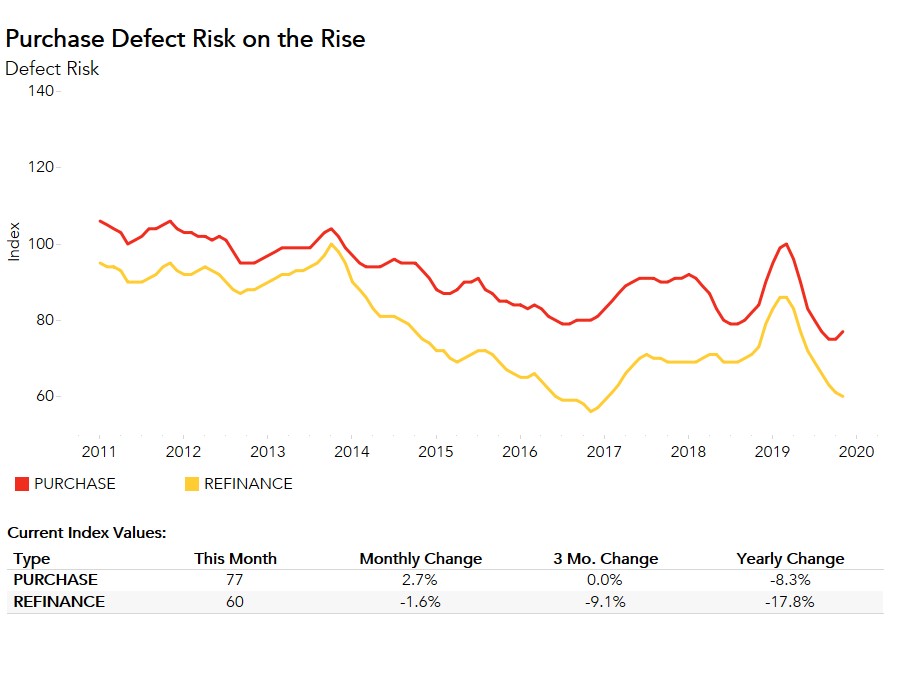
- The Defect Index for refinance transactions decreased by 5.5 percent compared with previous month, and decreased by 39.5 percent compared with a year ago.
- The Defect Index for purchase transactions decreased by 2.6 percent compared with the previous month, and is down 23.2 percent compared with a year ago.
February 2020 State Highlights
- There is no state with a year-over-year increase in defect frequency.
- The five states with the greatest year-over-year decrease in defect frequency are: West Virginia (-51.0 percent), North Carolina (-42.9 percent), Indiana (-42.3 percent), Montana (-42.2 percent), and Virginia (-42.2 percent).
February 2020 Local Market Highlights
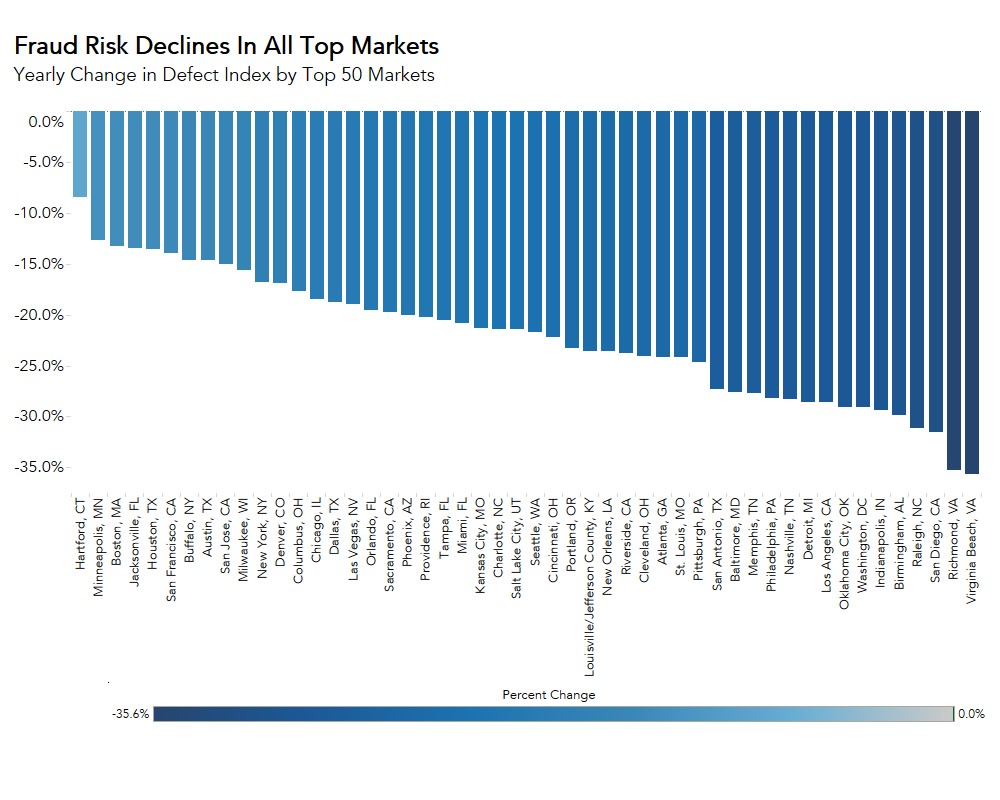
- Among the largest 50 Core Based Statistical Areas (CBSAs), there is no market with a year-over-year increase in defect frequency.
- Among the largest 50 Core Based Statistical Areas (CBSAs), the five markets with the greatest year-over-year decrease in defect frequency are: Richmond, Va. (-44.3 percent), Detroit (-43.3 percent), Virginia Beach, Va. (-43.0 percent), San Diego (-41.2 percent), and Indianapolis (-41.1 percent).
Methodology
The First American Loan Application Defect Index estimates the level of defects detected in the information submitted in mortgage loan applications processed by the First American FraudGuard® system. The index is based on the frequency with which defect indicators are identified. The Defect Index moves higher as greater numbers of defect indicators are identified. An increase in the index indicates a rising level of loan application defects. The index, nationally and in all markets, is benchmarked to a value of 100 in January 2011. Therefore, all index values can be interpreted as the percentage change in defect frequency relative to the defect frequency identified nationally in January 2011.