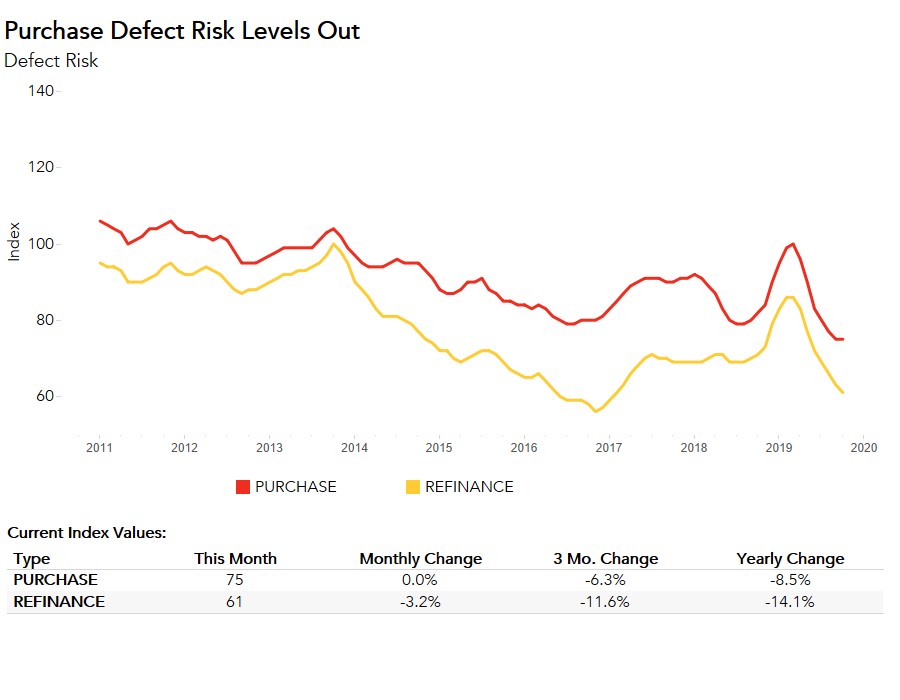
Based on our analysis, if mortgage rates continue to fall, the pressure on fraud risk may weaken. This has played out throughout most of 2019, as the 30-year, fixed mortgage rate has been falling since December 2018, and overall fraud risk alongside it. Fraud risk began declining in March 2019 and reached a historical low in October. The Loan Application Defect Index for refinance transactions has followed a similar trend, declining 14.1 percent between March and October 2019.
“As sellers’ market conditions ease their grip on the broader housing market, defect risk on purchase transactions remains likely to fall.”
However, defect risk for purchase transactions broke its six-month streak of declines in October. While still 8.5 percent lower than one year ago, defect risk remained flat compared with the previous month. October was also the first month since November 2018 where the 30-year, fixed mortgage rate increased month over month. Examining any potential link between defect risk trends and mortgage rates may shed light on what to expect for defect risk in the near future.
The Relationship Between House-Buying Power and Fraud Risk
House-buying power is how much home one can buy based on changes in household income and interest rates. When household income rises, consumer house-buying power increases. Decreasing mortgage rates also boost house-buying power.
Since December 2018, house-buying power has been increasing due to steadily rising household income and declining mortgage rates. In fact, house-buying power reached $421,120 in September 2019, the highest point in our analysis dating back to 1990. Yet, in October, when mortgage rates increased month over month for the first time since November 2018, house-buying power declined as well, falling 0.8 percent compared with the previous month. How might the mortgage rate-driven decline in house-buying power have played a role in ending the six-month decline in defect risk for purchase transactions?
Potential home buyers may feel more confident and less inclined to commit fraud when they are in a better financial position to purchase a home. In a supply-constrained market, a decline in house-buying power makes it more difficult for potential home buyers to compete with each other, so they may feel more pressure to misrepresent information on a loan application.
It’s important to remember that one month does not make a trend. House-buying power may decline further, but should remain strong by any recent historic standard. Additionally, new home construction is accelerating. More new homes may weaken the squeeze on supply and reduce competition among buyers and the pressure to misrepresent information on a loan application. As sellers’ market conditions loosen their grip on the broader housing market, defect risk on purchase transactions remains likely to fall.
For Mark’s full analysis on loan defect risk, the top five states and markets with the greatest increases and decreases in defect risk, and more, please visit the Loan Application Defect Index.
The Defect Index is updated monthly with new data. Look for the next edition of the Defect Index the week of December 30, 2019.
October 2019 Loan Application Defect Index
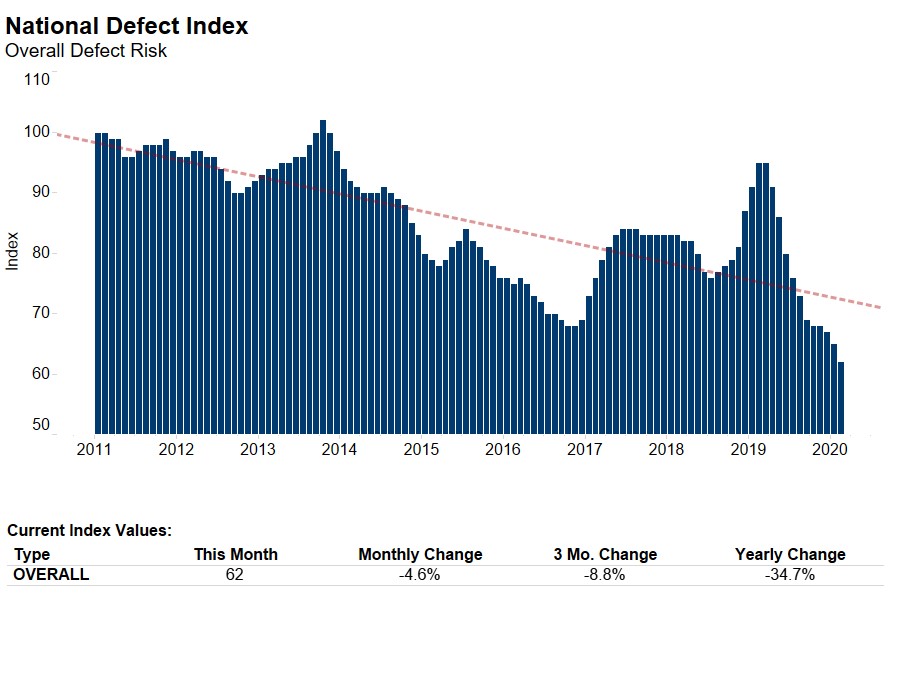
The First American Loan Application Defect Index showed that in October 2019:
- The frequency of defects, fraudulence and misrepresentation in the information submitted in mortgage loan applications decreased by 1.4 percent compared with the previous month.
- Compared to October 2018, the Defect Index decreased by 13.9 percent.
- The Defect Index is down 33.3 percent from the high point of risk in October 2013.
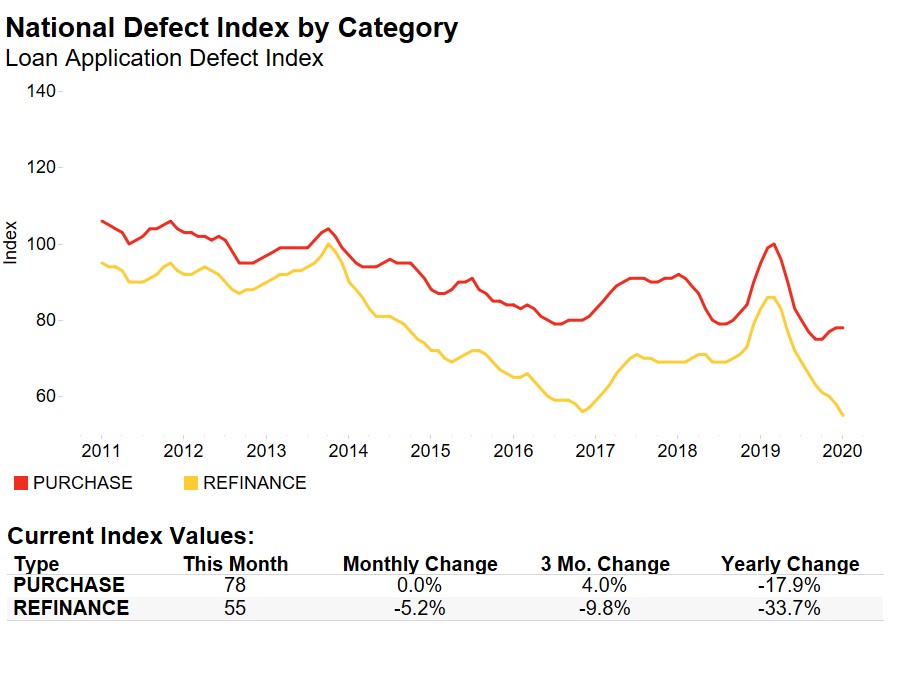
- The Defect Index for refinance transactions decreased by 3.2 percent compared with the previous month, and decreased by 14.1 percent compared with a year ago.
- The Defect Index for purchase transactions remained the same as the previous month, and is down 8.5 percent compared with a year ago.
October 2019 State Highlights
- The two states with a year-over-year increase in defect frequency are: South Dakota (+4.8 percent) and New York (+2.4 percent).
- The five states with a year-over-year decrease in defect frequency are: Alaska (-34.4 percent), West Virginia (-22.5 percent), Virginia (-21.7 percent), Delaware (-20.3 percent), and North Carolina (-20.2 percent).
October 2019 Local Market Highlights
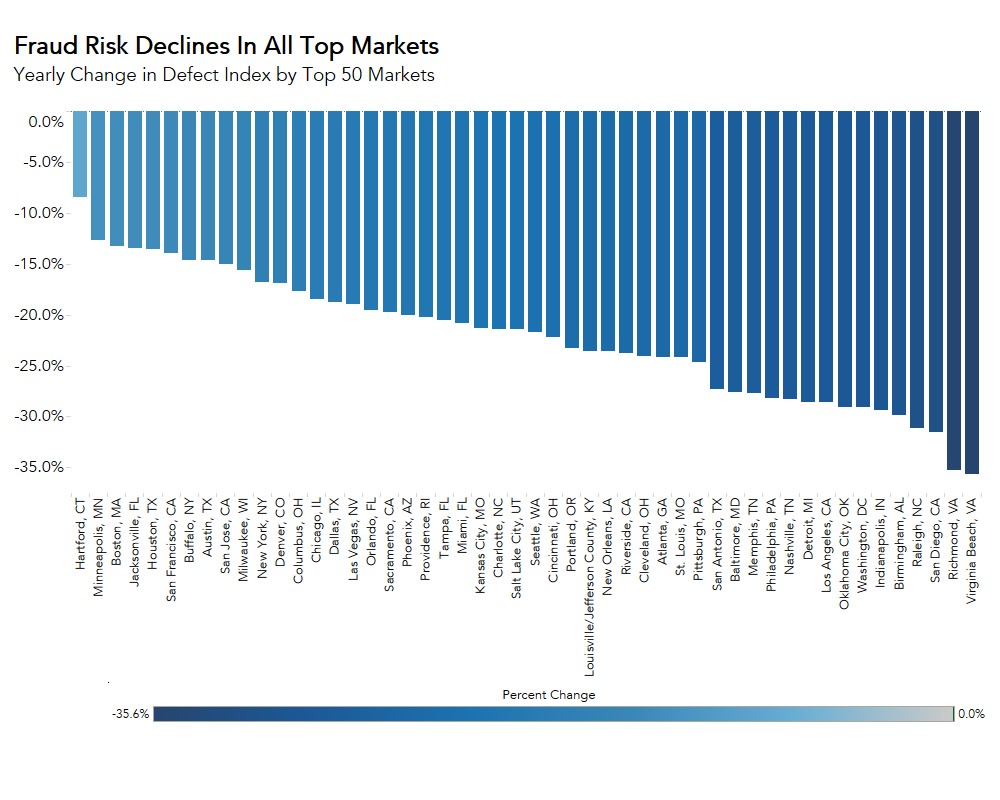
- Among the largest 50 Core Based Statistical Areas (CBSAs), only one market had a year-over-year increase in defect frequency: Hartford, Conn. (+3.2 percent).
- Among the largest 50 Core Based Statistical Areas (CBSAs), the five markets with a year-over-year decrease in defect frequency are: Virginia Beach, Va. (-25.8 percent), San Diego (-25.3 percent), San Antonio (-24.3 percent), Richmond, Va. (-23.7 percent), and Raleigh, N.C. (-23.2 percent).
Methodology
The First American Loan Application Defect Index estimates the level of defects detected in the information submitted in mortgage loan applications processed by the First American FraudGuard® system. The index is based on the frequency with which defect indicators are identified. The Defect Index moves higher as greater numbers of defect indicators are identified. An increase in the index indicates a rising level of loan application defects. The index, nationally and in all markets, is benchmarked to a value of 100 in January 2011. Therefore, all index values can be interpreted as the percentage change in defect frequency relative to the defect frequency identified nationally in January 2011.