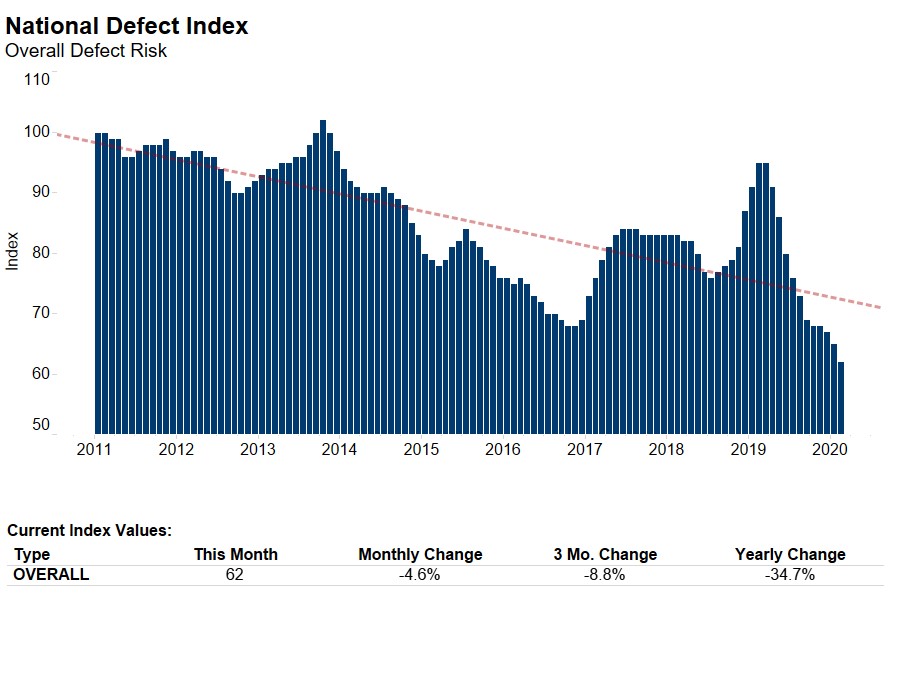
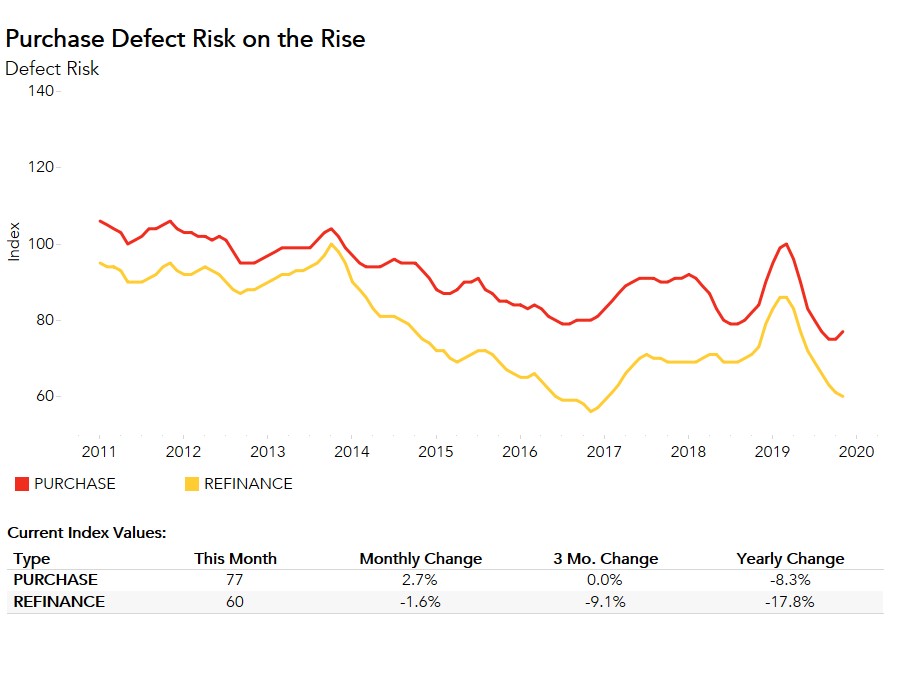
For the majority of 2019, overall fraud risk steadily declined, largely due to the rising volume of lower risk refinance transactions driven by low mortgage rates. After falling since March, overall defect risk stabilized in November, and then declined again in December. The overall Defect Index, which includes both purchase and refinance transactions, fell 1.5 percent compared with November, and is 23 percent lower than one year ago. While overall fraud risk declined in December, the pace of decline was slower than earlier in the year. The Defect Index for purchase transactions increased 1.3 percent compared with November, while the Defect Index for refinance transactions fell 3.3 percent, its ninth straight month of declining risk.
“While declining fraud risk is the new norm, should market composition shift back toward a greater share of higher risk purchase transactions, or the sellers’ market strengthens even further, we can expect an even slower pace of decline, or even a return to rising fraud risk.”
Why Did the Pace of Falling Fraud Risk Slow Down?
Defect, fraud and misrepresentation risk is significantly lower on refinance transactions, so the rise and fall of the share of higher risk purchase activity can significantly impact the overall Defect Index. The refinance share of the market was 30 percent in the first quarter of 2019, and is anticipated to have increased to 51 percent in the fourth quarter of 2019, as purchase transaction volume declines significantly during the holidays. Despite a slight increase in mortgage rates in December, applications to refinance a home increased 146 percent compared with the same month one year ago. The increase in the share of lower risk refinance transactions relative to purchase transactions contributed to the decline in overall fraud risk.
However, since fraud risk began to decline in March 2019, the average monthly rate of decline has remained fairly constant at approximately 4 percent. In December, fraud risk declined by a modest 1.5 percent. The reason? While low mortgage rates and a healthy labor market continue to boost house-buying power and home-buying demand, inventory remains near quarter-century lows. In December, nearly half of all existing homes that came on the market were gone within the month. The current three months’ supply is much lower than the six months’ supply that is considered a balanced market. This strong sellers’ market may pressure some home buyers to misrepresent information on a loan application in order to be more competitive when bidding for a home. Couple a supply-constrained market with increased refinance share, and the pace of fraud risk decline slows down.
The declining fraud risk trend was consistent across the country in December. Overall fraud risk did not increase in a single state or metropolitan area relative to one year ago, but fraud risk did rise in several markets on a month-over-month basis. While declining fraud risk is the new norm, should market composition shift back toward a greater share of higher risk purchase transactions, or the sellers’ market strengthens even further, we can expect an even slower pace of decline, or even a return to rising fraud risk.
The Defect Index is updated monthly with new data. Look for the next edition of the Defect Index the week of February 24, 2020.
December 2019 Loan Application Defect Index
The First American Loan Application Defect Index showed that in December 2019:
- The frequency of defects, fraudulence and misrepresentation in the information submitted in mortgage loan applications decreased by 1.5 percent compared with the previous month.
- Compared to November 2018, the Defect Index decreased by 16.0 percent.
- The Defect Index is down 34.3 percent from the high point of risk in October 2013.
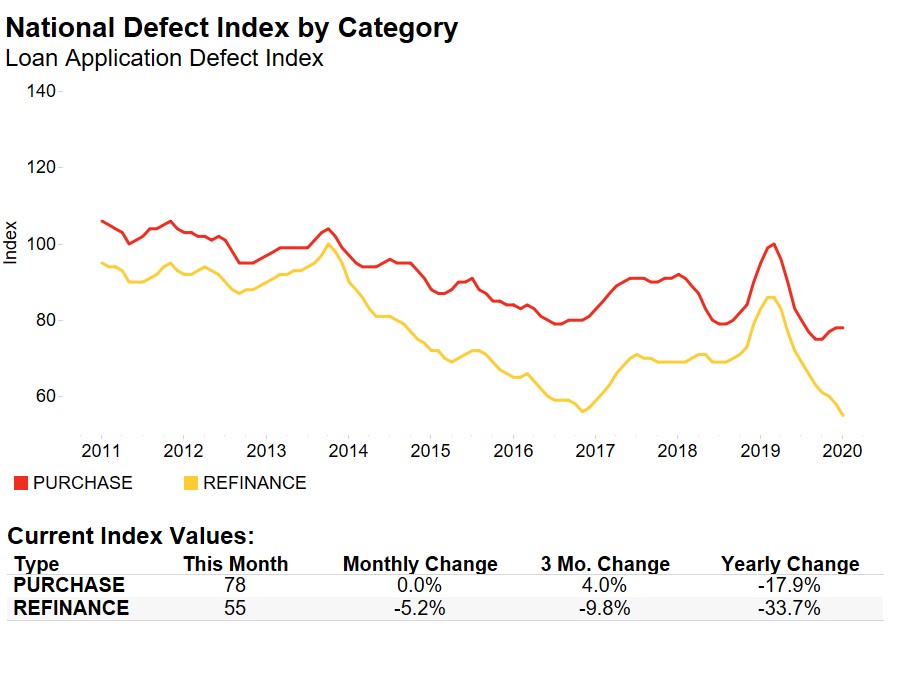
- The Defect Index for refinance transactions decreased by 3.3 percent compared with the previous month, and decreased by 26.6 percent compared with a year ago.
- The Defect Index for purchase transactions increased by 1.3 percent compared with the previous month, and is down 13.3 percent compared with a year ago.
December 2019 State Highlights
- There is no state with a year-over-year increase in defect frequency.
- The five states with the greatest year-over-year decrease in defect frequency are: West Virginia (-42.7 percent), Alaska (-35.1 percent), North Carolina (-31.9 percent), Virginia (-31.5 percent), and Indiana (-35.1 percent).
December 2019 Local Market Highlights
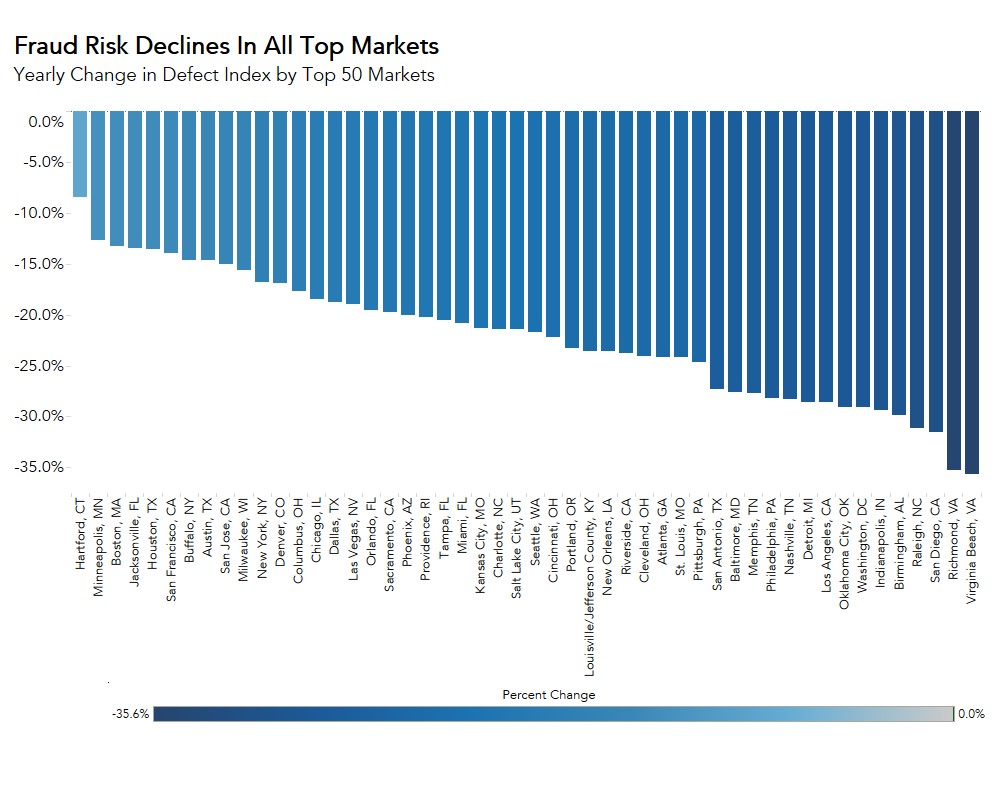
- Among the largest 50 Core Based Statistical Areas (CBSAs), there is no market with a year-over-year increase in defect frequency.
- Among the largest 50 Core Based Statistical Areas (CBSAs), the five markets with the greatest year-over-year decrease in defect frequency are: Virginia Beach, Va. (-35.6 percent), Richmond, Va. (-35.3 percent), San Diego (-31.6 percent), Raleigh, N.C. (-31.1 percent), and Birmingham, Ala. (-29.9 percent).
Methodology
The First American Loan Application Defect Index estimates the level of defects detected in the information submitted in mortgage loan applications processed by the First American FraudGuard® system. The index is based on the frequency with which defect indicators are identified. The Defect Index moves higher as greater numbers of defect indicators are identified. An increase in the index indicates a rising level of loan application defects. The index, nationally and in all markets, is benchmarked to a value of 100 in January 2011. Therefore, all index values can be interpreted as the percentage change in defect frequency relative to the defect frequency identified nationally in January 2011.