Two of the three key drivers of the Real House Price Index (RHPI), household income and mortgage rates, swung in favor of increased affordability in June. The 30-year, fixed-rate mortgage fell by 0.8 percentage points and household income increased 2.4 percent compared with June 2018. When household income rises, consumer house-buying power increases. Declining mortgage rates have a similar impact on affordability, so in June home buyers received a double shot of house-buying power to jolt affordability in their favor nationally.
“The true cost of housing reflects a consumers’ purchasing power, which is a function of mortgage rates and incomes, and in June, those measures tipped the scale in favor of affordability.”
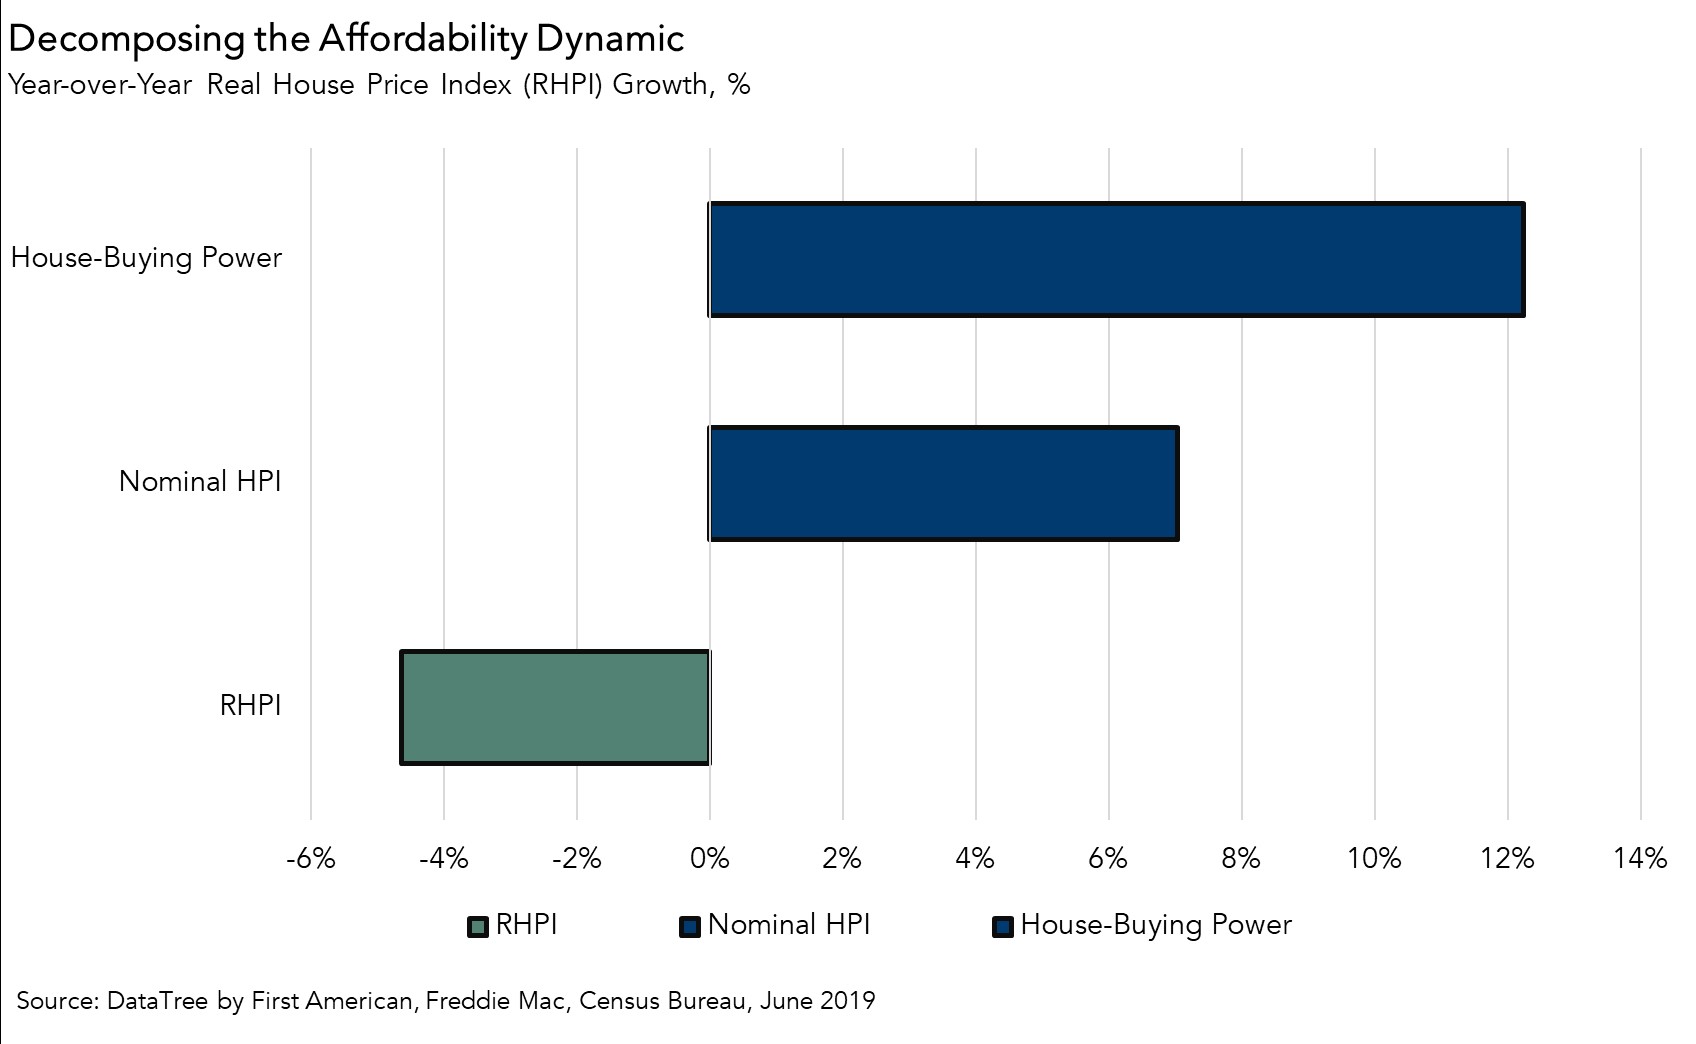
The third component of the RHPI, nominal house prices, experienced a year-over-year increase of 7.0 percent in June. Increases in nominal house prices make housing less affordable. Yet, the RHPI experienced a 4.6 percent decline compared with one year ago. The reason? The true cost of housing reflects a consumers’ purchasing power, which is a function of mortgage rates and incomes, and in June, those measures tipped the scale in favor of affordability.
Breaking Down the Forces Shaping Affordability
The continual “tug-of-war” between house-buying power and nominal house prices, ultimately determines the fate of real house prices. We’ve examined each of the driving forces shaping affordability today below:
- Household Income: Currently, the unemployment rate in the U.S. is at a 50-year low, jobs are plentiful, and wages are rising. In June, average hourly earnings increased 3.3 percent compared with one year ago, which translates to a 2.4 percent increase in household income. Since June 2018, household income growth increased consumer house-buying power by $8,600.
- Mortgage rates: The 30-year, fixed-rate mortgage began declining in December 2018, and has continued to fall since. Cheaper mortgages boost the housing market by improving affordability. Since June 2018, falling mortgages rates have increased consumer house-buying power by $35,000.
- Nominal House Prices: Rising house-buying power due to lower mortgage rates and strong income growth boosts affordability and supports demand. However, when demand increases for a scarce good, such as housing, prices will rise faster. Indeed, as predicted, nominal house price appreciation began to accelerate in April 2019, and has continued since. Faster house price appreciation works to reduce affordability.
Consumer House-Buying Power Outweighs Rising House Prices
The net effect of these dynamics? Consumer house-buying increased by $44,000 (12.2 percent) in June compared with one year ago, more than enough to overcome the 7 percent increase of nominal house price appreciation. In fact, house-buying power is the highest it’s been since we began tracking it in 1991.
Traditional house prices focus on the actual prices, but they overlook what matters most to potential buyers – their purchasing power, or how much they can afford to buy. Rising nominal house prices alone may convince potential buyers that housing is not as affordable in June 2019 as it was one year ago. However, when you consider the rise in incomes and the lower mortgage rates, housing nationally is 4.6 percent more affordable than one year ago. Of course, if purchasing power continues to rise and drive greater demand, we can expect nominal house price appreciation to increase, leaving the future of affordability unclear.
For more analysis of affordability, please visit the Real House Price Index. The RHPI is updated monthly with new data. Look for the next edition of the RHPI the week of September 23, 2019.
Sources:
June 2019 Real House Price Index Highlights
The First American Real House Price Index (RHPI) showed that in June 2019:
- Real house prices decreased 2.2 percent between May 2019 and June 2019.
- Real house prices declined 4.6 percent between June 2018 and June 2019.
- Consumer house-buying power, how much one can buy based on changes in income and interest rates, increased 3.3 percent between May 2019 and June 2019, and increased 12.2 percent year over year.
- Average household income has increased 2.4 percent since June 2018 and 56.4 percent since January 2000.
- Real house prices are 18.0 percent less expensive than in January 2000.
- While unadjusted house prices are now 6.3 percent above the housing boom peak in 2006, real, house-buying power-adjusted house prices remain 41.3 percent below their 2006 housing boom peak.
June Real House Price State Highlights
- There were no states with a year-over-year increase in the RHPI.
- The five states with the greatest year-over-year decrease in the RHPI are: Wyoming (-9.8 percent), North Dakota (-9.3 percent), California (-9.3 percent), West Virginia (-8.5 percent), and New Mexico (-8.3 percent).
June 2019 Real House Price Local Market Highlights
- Among the Core Based Statistical Areas (CBSAs) tracked by First American, the only market with a year-over-year increase in the RHPI is: Providence, R.I. (+1.3 percent).
- Among the Core Based Statistical Areas (CBSAs) tracked by First American, the five markets with the greatest year-over-year decrease in the RHPI are: San Jose, Calif. (-15.9 percent), Seattle (-10.9 percent), Portland, Ore. (-10.4 percent), San Francisco (-10.4 percent), and Los Angeles (-8.7 percent).
About the First American Real House Price Index
The traditional perspective on house prices is fixated on the actual prices and the changes in those prices, which overlooks what matters to potential buyers - their purchasing power, or how much they can afford to buy. First American’s proprietary Real House Price Index (RHPI) adjusts prices for purchasing power by considering how income levels and interest rates influence the amount one can borrow.
The RHPI uses a weighted repeat-sales house price index that measures the price movements of single-family residential properties by time and across geographies, adjusted for the influence of income and interest rate changes on consumer house-buying power. The index is set to equal 100 in January 2000. Changing incomes and interest rates either increase or decrease consumer house-buying power. When incomes rise and mortgage rates fall, consumer house-buying power increases, acting as a deflator of increases in the house price level. For example, if the house price index increases by three percent, but the combination of rising incomes and falling mortgage rates increase consumer buying power over the same period by two percent, then the Real House Price index only increases by 1 percent. The Real House Price Index reflects changes in house prices, but also accounts for changes in consumer house-buying power.
Disclaimer
Opinions, estimates, forecasts and other views contained in this page are those of First American’s Chief Economist, do not necessarily represent the views of First American or its management, should not be construed as indicating First American’s business prospects or expected results, and are subject to change without notice. Although the First American Economics team attempts to provide reliable, useful information, it does not guarantee that the information is accurate, current or suitable for any particular purpose. © 2019 by First American. Information from this page may be used with proper attribution.


