Throughout 2018, consistent growth among three driving forces – mortgage rates, household income, and unadjusted house prices – defined the housing market. These three factors are also the core metrics that comprise the Real House Price Index (RHPI). November 2018 was no exception, as household income, mortgage rates, and the unadjusted house price index all increased compared with a year ago. The 30-year, fixed-rate mortgage increased by nearly 1.0 percent and the unadjusted house price index jumped 6.7 percent. Household income increased 3.5 percent since November 2017, which boosted consumer house-buying power, but the RHPI still increased 15.3 percent compared with last November due to the rise in mortgage rates and unadjusted house prices.
“Recent inventory increases and the slowdown in house price appreciation are not coincidences and may be the first signs of a weakening sellers’ market, which is good news for home buyers.”
While the RHPI increase means affordability decreased nationally, the yearly growth in the RHPI slowed somewhat in November compared with the previous month. But, what cities are at the leading edge of this cooling trend?
Where is Affordability Improving?
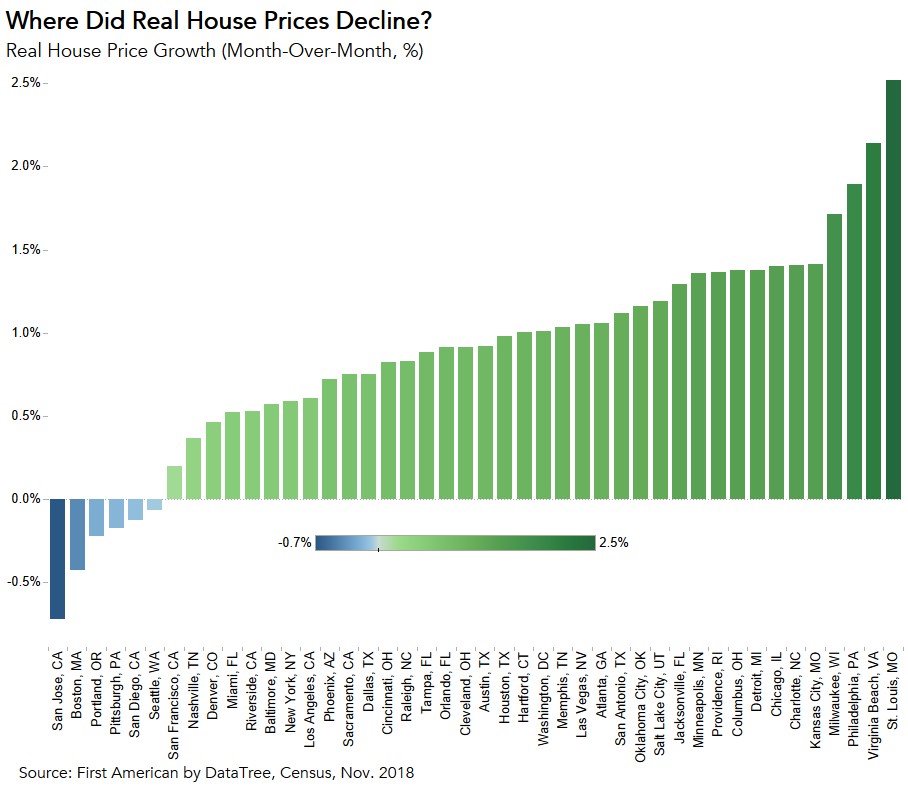
Six cities are leading the shift in the housing market. Consider that in October 2018, real house prices increased month over month in all 44 of the markets we track in the RHPI. In November, however, some outliers emerged. Real house prices declined in six cities, signaling an improvement in affordability. The six markets with a month-over-month decline in the RHPI were:
- San Jose, CA (- 0.7 percent)
- Boston, MA (- 0.4 percent)
- Portland, OR (- 0.2 percent)
- Pittsburgh, PA (- 0.2 percent)
- San Diego, CA (- 0.1 percent)
- Seattle, WA (- 0.1 percent)

Rising inventory is one reason these markets are bucking the national trend. According to Realtor.com, the number of active listings increased year over year in five of the six markets listed. In San Jose, Seattle, and San Diego, the increase in active listings was substantial, as active listings jumped 158 percent, 77 percent, and 46 percent, respectively. As more inventory enters the market, buyers have more options, bidding wars are less likely and sellers start reducing list prices.
Is This the Beginning of a Cooling Housing Market?
These six outliers may signal a broader shift in the housing market. Not only did affordability increase in these six markets, but monthly real house price appreciation slowed in the other 38 markets we track. Recent inventory increases and the slowdown in house price appreciation are not coincidences and may be the first signs of a weakening sellers’ market, which is good news for home buyers. Based on what we already know about mortgage rates in December, we expect affordability will increase in even more markets in next month’s (December) RHPI, as increasing inventory, rising income, and the December decline in mortgage rates are likely to drive further decreases in the RHPI.
The RHPI is updated monthly with new data. Look for the next edition of the RHPI the week of February 25, 2019.
Sources:
November 2018 Real House Price Index Highlights
The First American Real House Price Index (RHPI) showed that in November 2018:
- Real house prices increased 0.8 percent between October 2018 and November 2018.
- Real house prices increased 15.3 percent year over year.
- Consumer house-buying power, how much one can buy based on changes in income and interest rates, decreased 0.04 percent between October 2018 and November 2018, and declined 7.5 percent year over year.
- Average household income has increased 3.5 percent since November 2017 and 54.3 percent since January 2000.
- Real house prices are 9.0 percent less expensive than in January 2000.
- While unadjusted house prices are now 1.8 percent above the housing boom peak in 2006, real, house-buying power-adjusted house prices remain 35.3 percent below their 2006 housing boom peak.
November 2018 Real House Price State Highlights
- The five states with the greatest year-over-year increase in the RHPI are: Ohio (+22.4 percent), Nevada (+21.3 percent), Georgia (+20.0 percent), New Hampshire (+19.6 percent), and Mississippi (+19.4 percent).
- No state had a year-over-year decrease in the RHPI in November.
November 2018 Real House Price Local Market Highlights
- Among the Core Based Statistical Areas (CBSAs) tracked by First American, the five markets with the greatest year-over-year increase in the RHPI are: Cleveland (+30.7 percent), Las Vegas (+24.1 percent), Charlotte, N.C. (+23.7 percent), Cincinnati (+23.2 percent), and Atlanta (+22.2 percent).
- No CBSA had a year-over-year decrease in the RHPI in November.


