The surge in mortgage rates from mid-2022 through 2023 triggered a housing recession, with the most pronounced impact felt in a steep decline in sales, while prices have remained relatively stable. Specifically, existing-home sales plunged to a more than 12-year low in September of this year. Rising mortgage rates have a dual impact on the housing market – reducing affordability for buyers and strengthening the rate lock-in effect for potential sellers.
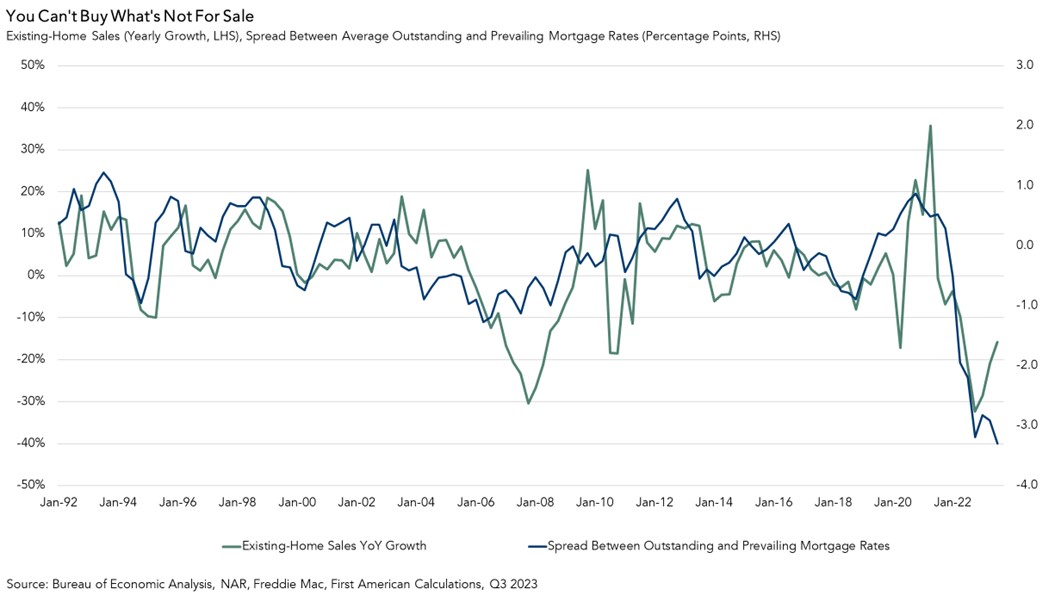
Historically, existing homes have made up nearly 90 percent of all for-sale inventory. Yet, in today’s housing market, more than 90 percent of homeowners are financially disincentivized from selling their home because it would cost more to borrow the same amount of money they owe on their current mortgage. You can’t buy what’s not for sale, and existing homeowners aren’t selling.
Is 2024 the year that existing-home inventory is unlocked or will the ‘sellers’ strike’ continue?
“Even though mortgage rates may decline, it’s unlikely that it will be sufficient to end the sellers’ strike in 2024.”
The Blight, the Bright, and What Seems Just Right
The housing market of 2024 will likely present many of the same challenges as the market of 2023, but with the benefit of some added certainty from the Federal Reserve on its monetary policy. The Fed’s own projections indicate that the end of monetary tightening is close, if not already here. As a result of more certainty around Fed action, there could be some downward pressure on mortgage rates, or at the very least, some stability. Industry consensus forecasts indicate that mortgage rates will end 2024 at 6.4 percent, which is a significant improvement over the peak of nearly 8 percent this year. If rates do come down from recent highs, the housing market may benefit, but headwinds will remain.
The Blight
Unfortunately, even mortgage rates of 6.4 percent will not significantly alleviate the market from the rate lock-in effect, as 90 percent of homeowners are locked into rates below 6 percent. These existing homeowners will still withhold inventory from the market, which will keep upward pressure on house prices and limit affordability. You can’t have more existing-home sales without more existing-home inventory. Even though mortgage rates may decline, it’s unlikely that it will be sufficient to end the sellers’ strike in 2024.
The Bright
The October First American Data & Analytics Home Price Index indicated that house prices reached a new peak for the seventh month in a row last month. While higher house prices limit affordability, all else held equal, they also increase the equity cushion of existing homeowners. Homeowner equity is already sitting near historic highs, and for some of those equity-rich homeowners, that means moving and taking on a higher interest rate isn’t a huge deal—especially if they are moving to a less expensive home. Additionally, 42 percent of owned homes are owned free and clear. These free-and-clear homeowners may hold the key to unlocking some much-needed supply for today’s housing market.
If mortgage rates do fall from the October 2023 rate of 7.6 percent to the consensus forecast of 6.4 percent, house-buying power (holding house incomes constant) will increase by nearly $42,000. Additionally, a large cohort of millennials are reaching prime buying age, and the post-pandemic new normal continues to offer greater flexibility to work from home, helping to fuel homeownership demand.
What Seems Just Right
The pre-pandemic historic average for existing-home sales is approximately 5 million seasonally adjusted annualized (SAAR) sales. The latest data suggests that sales have declined below 4 million SAAR. The outlook for existing-home sales in 2024 is a modest improvement from 2023 levels, but not quite back to historic norms. Lower mortgage rates in 2024 will likely not be low enough to end the sellers’ strike entirely, but for those homeowners who do choose to sell, improved affordability for potential buyers means there will be someone to buy it at the right price.
October 2023 Potential Home Sales
For the month of October, First American Data & Analytics updated its proprietary Potential Home Sales Model to show that:
- Potential existing-home sales decreased to a 5.26 million seasonally adjusted annualized rate (SAAR), a 1.0 percent month-over-month decrease.
- This represents a 50.8 percent increase from the market potential low point reached in February 1993.
- The market potential for existing-home sales increased 1.8 percent compared with a year ago, a gain of 95,000 (SAAR) sales.
- Currently, potential existing-home sales is 1,533,500 (SAAR), or 22.6 percent, below the peak of market potential, which occurred in April 2006.
First American Deputy Chief Economist Odeta Kushi contributed to this post.
What Insight Does the First American Data & Analytics Potential Home Sales Model Reveal?
When considering the right time to buy or sell a home, an important factor in the decision should be the market’s overall health, which is largely a function of supply and demand. Knowing how close the market is to a healthy level of activity can help consumers determine if it is a good time to buy or sell, and what might happen to the market in the future. That is difficult to assess when looking at the number of homes sold at a particular point in time without understanding the health of the market at that time. Historical context is critically important. Our potential home sales model measures what a healthy market for home sales should be based on the economic, demographic and housing market environments.
About the First American Data & Analytics Potential Home Sales Model
Potential home sales measures existing-home sales, which include single-family homes, townhomes, condominiums and co-ops on a seasonally adjusted annualized rate based on the historical relationship between existing-home sales and U.S. population demographic data, homeowner tenure, house-buying power in the U.S. economy, price trends in the U.S. housing market, and conditions in the financial market. When the actual level of existing-home sales are significantly above potential home sales, the pace of turnover is not supported by market fundamentals and there is an increased likelihood of a market correction.
Conversely, seasonally adjusted, annualized rates of actual existing-home sales below the level of potential existing-home sales indicate market turnover is underperforming the rate fundamentally supported by the current conditions. Actual seasonally adjusted annualized existing-home sales may exceed or fall short of the potential rate of sales for a variety of reasons, including non-traditional market conditions, policy constraints and market participant behavior. Recent potential home sale estimates are subject to revision to reflect the most up-to-date information available on the economy, housing market and financial conditions. The Potential Home Sales model is published prior to the National Association of Realtors’ Existing-Home Sales report each month.


