
Key Points:
- Annual affordability improved in 43 of the top 50 U.S. markets in April.
- 11 markets posted both above-average supply and above-average affordability improvement.
- Miami leads in supply (7.2 months), while Hartford remains the tightest market (1.7 months).
Affordability nationally improved 4.4 percent annually in April, as mortgage rates fell, nominal house prices slowed and household incomes improved, all helping boost affordability. Aside from a four-month period at the end of 2024, this marks the greatest annual increase in affordability since 2020, according to the Real House Price Index (RHPI). There was a slight dip in affordability month over month, but the year over year improvement is encouraging for home buyers.
Many buyers remain sidelined, struggling to make the payment-to-paycheck math work, so even modest improvements can make a difference. But beneath the national headline, affordability trends vary sharply across regions, driven by differences in market dynamics – specifically months of supply, a metric which reflects both inventory levels and the pace of sales.
“The affordability story this summer will largely hinge on where—and how much—inventory continues to rise.”
Regional Divide in Months’ Supply Driving Affordability Gains
In a recent analysis, we explored the relationship between national months of supply and house price growth. Months of supply measures the time it would take to deplete the inventory of homes for sale at the current sales rate. This metric helps determine whether the market favors buyers or sellers. Generally, higher months of supply puts downward pressure on prices, while lower months of supply tends to accelerate price appreciation.
In our current analysis, we examine the top 50 U.S. markets, calculating months of supply by dividing the number of houses for sale by the number of homes sold that month, using Zillow data. According to the U.S. Census Bureau's regional definitions, we found that months of supply were higher in Southern and Western markets, but more subdued in the Northeast and Midwest. In April, 27 of the top 50 markets had a higher months of supply compared to pre-pandemic April 2019.

The scatterplot below divides the top 50 markets into four quadrants, with the y-axis representing annual months of supply and the x-axis representing affordability growth as measured by the RHPI1. The analysis reveals a statistically significant correlation between rising months of supply and improving affordability. More inventory sitting on the market longer means more choices for buyers, less bidding competition and, ultimately, a moderating effect on prices and an improvement in affordability.
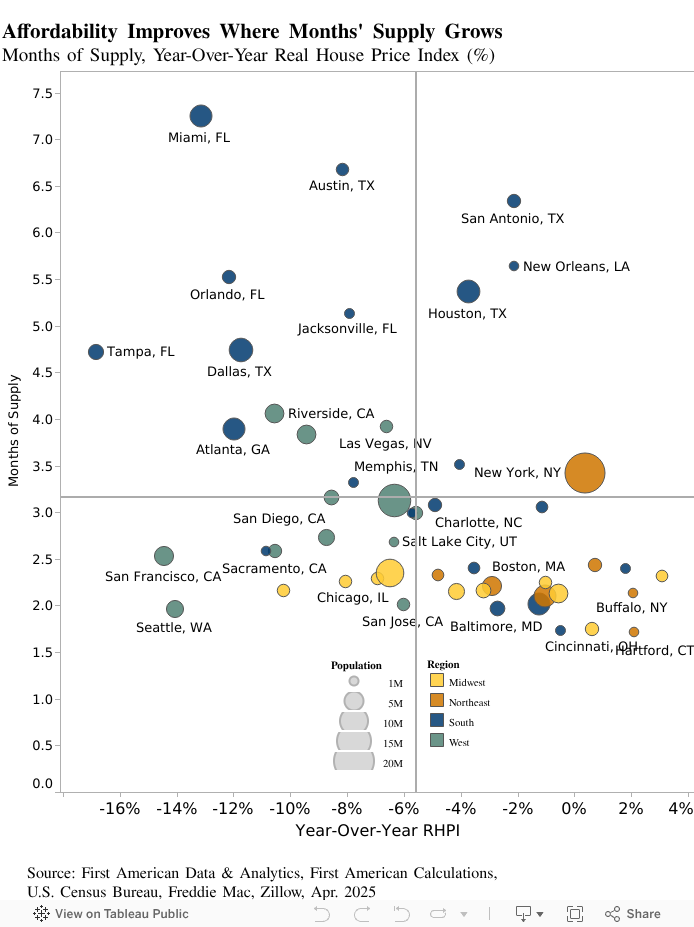
Note: The lines on the y and x axes indicate the averages, so markets above the horizontal line have above-average inventory growth, and those to the right of the vertical line have above-average declines in affordability.
In April, affordability improved in 43 of the top 50 markets. Among those, 15 markets had above-average months of supply, landing in the scatterplot’s top two quadrants. Miami leads the pack, with 7.2 months of supply (up from 5.5 in pre-pandemic April 2019), driven by a 25 percent jump in active inventory and an 11 percent drop in sales. Consequently, prices in Miami fell 1.5 percent year over year, and affordability improved by 13 percent. More broadly, 11 markets with above-average months of supply also posted above-average affordability gains (top-left quadrant), a clear sign that increasing inventory is helping restore balance.
At the other end of the spectrum in the bottom-right quadrant is Hartford, Conn., with the nation’s lowest months of supply at just 1.7 (down from 4.3 months pre-pandemic). In Hartford, inventory increased just 2.1 percent, while sales dipped only 2.7 percent compared with a year ago. Prices jumped 6.5 percent on an annual basis, making Hartford one of only seven markets where affordability declined year over year.
More Supply, More Balance Ahead
As more Southern and Western markets see months of supply swell, we expect some continued downward pressure on prices in these areas, offering a path to improved affordability for patient buyers. Meanwhile, tighter Northeastern and Midwestern markets are likely to see more persistent price strength, unless supply improves. The affordability story this summer will largely hinge on where—and how much—inventory continues to rise.
Sources:
• First American Data & Analytics
• Freddie Mac
• Census Bureau
April 2025 Real House Price Index Highlights
The First American Data & Analytics’ Real House Price Index (RHPI) showed that in April 2025:
- Real house prices decreased 4.4 percent between April 2024 and April 2025.
- Real house prices increased 0.4 percent between March 2025 and April 2025.
- Consumer house-buying power, how much one can buy based on changes in income and mortgage rates, decreased 0.3 percent between March 2025 and April 2025, and increased 6.9 percent year over year.
- Median household income has increased 4.0 percent since April 2024 and 57.1 percent since January 2015.
- Real house prices are 33.3 percent more expensive than in January 2000.
- Unadjusted house prices are now 63.6 percent above the housing boom peak in 2006, while real, house-buying power-adjusted house prices are 6.6 percent below their 2006 housing boom peak.
April 2025 Real House Price State Highlights
- The five states with the greatest year-over-year increase in the RHPI are: Maine (+7.5 percent), New Hampshire (+3.4 percent), North Dakota (+3.4 percent), Rhode Island (+3.0 percent), and Connecticut (+1.6 percent).
- The five states with the greatest year-over-year decrease in the RHPI are: Florida (-10.9 percent), Colorado (-9.0 percent), Texas (-8.5 percent), Mississippi (-7.6 percent), and Indiana (-7.4 percent).
April 2025 Real House Price Local Market Highlights
- Among the Core Based Statistical Areas (CBSAs) tracked by First American Data & Analytics, the five markets with the greatest year-over-year increase in the RHPI are: Milwaukee (+3.1 percent), Hartford, Conn. (+2.1 percent), Buffalo, N.Y. (+2.1 percent), Louisville, Ky. (+1.8 percent), and Pittsburgh (+0.7 percent).
- Among the Core Based Statistical Areas (CBSAs) tracked by First American Data & Analytics, the five markets with the greatest year-over-year decrease in the RHPI are: Tampa, Fla. (-16.8 percent), San Francisco (-14.4 percent), Seattle (-14.1 percent), Miami (-13.2 percent), and Orlando, Fla. (-12.2 percent).
Next Release
The next release of the First American Data & Analytics’ Real House Price Index will take place the week of July 28, 2025.
About the First American Data & Analytics’ Real House Price Index
The traditional perspective on house prices is fixated on the actual prices and the changes in those prices, which overlooks what matters to potential buyers - their purchasing power, or how much they can afford to buy. First American Data & Analytics’ proprietary Real House Price Index (RHPI) adjusts prices for purchasing power by considering how income levels and interest rates influence the amount one can borrow.
The RHPI uses a weighted repeat-sales house price index that measures the price movements of single-family residential properties by time and across geographies, adjusted for the influence of income and interest rate changes on consumer house-buying power. The index is set to equal 100 in January 2000. Changing incomes and interest rates either increase or decrease consumer house-buying power. When incomes rise and mortgage rates fall, consumer house-buying power increases, acting as a deflator of increases in the house price level. For example, if the house price index increases by three percent, but the combination of rising incomes and falling mortgage rates increase consumer buying power over the same period by two percent, then the Real House Price index only increases by 1 percent. The Real House Price Index reflects changes in house prices, but also accounts for changes in consumer house-buying power.
Disclaimer
Opinions, estimates, forecasts and other views contained in this page are those of First American’s Chief Economist, do not necessarily represent the views of First American or its management, should not be construed as indicating First American’s business prospects or expected results, and are subject to change without notice. Although the First American Economics team attempts to provide reliable, useful information, it does not guarantee that the information is accurate, current or suitable for any particular purpose. © 2025 by First American. Information from this page may be used with proper attribution.
[1] Higher RHPI values indicate declining affordability.


