What defines a housing recession? While some rules of thumb exist, there has never been general agreement on a definition. If you look at today’s housing market, existing-home sales have struggled to gain any momentum during what is usually the housing market’s busiest season. New home sales, on the other hand, have exceeded all expectations. So, is the housing market in a recession? The existing-home market might be, but the new-home market seems to be in recovery mode.
“June and July data is still trickling in, but early signs point to a double-dip recession that began to take form in March of this year.”
To determine if the housing market is in a recession, we created a comprehensive, rule-based model based on the National Bureau of Economic Research Business Cycle Dating Committee’s (NBER BCDC) method of calling recessions, which relies on eight economic indicators. By finding the housing equivalent of these indicators, we can begin to form a definition of a housing market recession.
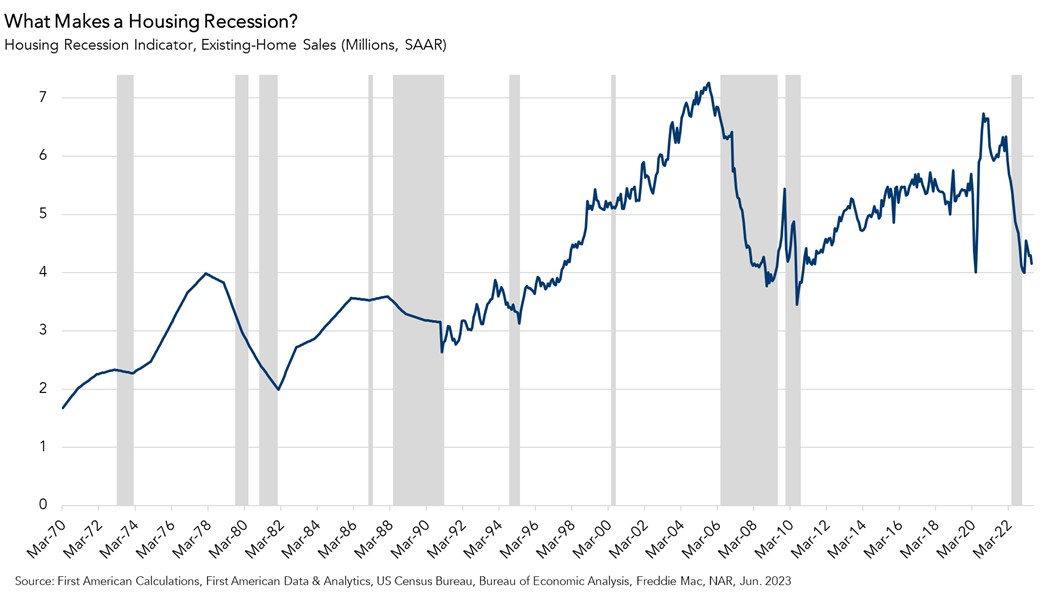
What Makes a Housing Recession?
The chart below plots our housing recession model alongside existing-home sales over time back to 1970. While existing-home sales often fall during housing recessions, this is not always the case, making it important to look at multiple indicators[1] when defining a housing recession. Our housing recession model is based on the following indicators: average hourly earnings of non-supervisory construction workers; the total number of employees in residential building construction; the total number of employees in real estate rental and leasing; the number of single-family housing starts; private residential fixed investment; personal consumption expenditures on housing and utilities; existing-home sales; and our Real House Price Index, which is a measure of affordability. If the moving average of the monthly growth rate of four of the eight indicators[2] is negative for at least three consecutive months[3], then a housing recession has begun.
A History of Recessions
When analyzing historical trends, several key findings emerge. Our model identifies 10 distinct housing recessions since 1970. For example, in 1979 and again in 1981 the housing market was considered in recession. In the late 1970s and early 1980s, interest rates were soaring as the Federal Reserve was combating the “Great Inflation.” As a result of tighter monetary policy and higher inflation, mortgage rates increased to a peak of about 18 percent in 1981. As mortgage rates soared to levels unseen before or since, homes were becoming significantly less affordable and home sales and new construction was falling.
Fast forward to another housing recession period, 2006 through 2010. The housing crisis in the Great Recession was fueled heavily by the fact that job loss was paired with a significant share of homeowners who did not have sufficient equity in their homes. Six of the eight indicators generally agreed that housing was in recession during this period. The only indicator that did not experience a significant decline was the average hourly earnings of construction workers because wages tend to be downside sticky, meaning that they can move up easily but move down only with difficulty.
The housing recession of 2022 began in May and ended in November. The average 30-year, fixed mortgage rate increased by 1.6 percentage points during those months, which resulted in a 14 percent decline in affordability. As a result of the rapid decline in affordability, builders pulled back on breaking ground on more homes. Additionally, higher mortgage rates had a dual impact on existing-home sales – pricing out buyers who lost purchasing power and keeping some potential sellers’ rate-locked in, resulting in fewer transactions.
The housing market recession paused in December as rates came down from recent highs, and in the first couple months of 2023, the housing market began to recover as rates stabilized and the new home market began to take market share from the existing-home market. Yet, mortgage rates once again trended higher in May and affordability suffered as a result. Sales of existing homes have remained low.
Is a Double-Dip Housing Recession on the Horizon?
June and July data is still trickling in, but early signs point to a double-dip recession that began to take form in March of this year. It is not surprising that the housing market continues to struggle, even if a small segment of the housing market, new construction, seems to be bucking that trend. Existing homes make up the bulk of total inventory, and existing homeowners are not selling. Potential home buyers are still contending with higher mortgage rates and a limited inventory of homes for sale.
Real estate is a very interest rate-sensitive sector, which is why when the Fed first hit the proverbial breaks on the economy by hiking interest rates, the housing sector responded so “recessionarily.” As long as the Fed’s fight against inflation persists, it will continue to put downward pressure on the housing market because mortgage rates typically follow the same path as long-term bond yields, which move with inflation expectations and the Fed’s actions. But housing recessions come in all shapes and sizes, and it seems that the worst of this housing recession is behind us.
[1] Some measures that are only reported quarterly (PCE housing services and residential fixed investment) were linearly interpolated to monthly. Historical existing-home sales data was also linearly interpolated from annual to monthly.
[2] Due to data limitations, prior to 1990, only three indicators must be negative to indicate recession, whereas after 1990 it must be four.
[3] If there is a single month between periods of recession, that month is also considered to be in recession.


