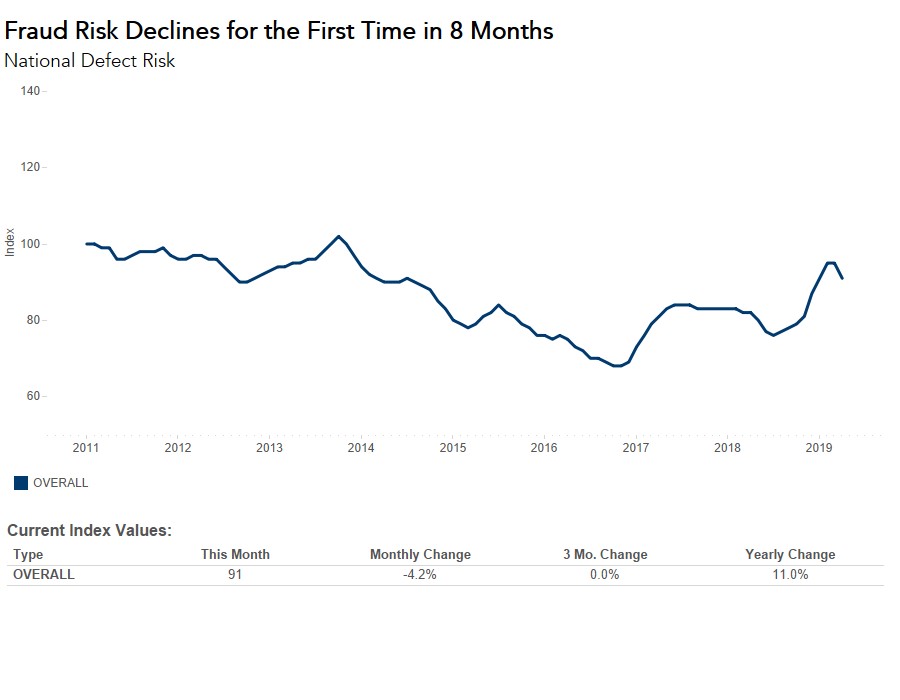
The frequency of defects, fraudulence and misrepresentation in the information submitted in mortgage loan applications declined 4.2 percent compared to last month. Notably, this marks the first month-over-month decline since July 2018, thanks to lower mortgage rates. Decreasing mortgage rates contributed to an increase in inventory, reducing the competitive pressure on the housing market, as well as contributing to an increase in lower-risk refinance transactions.
“The future of fraud and misrepresentation risk is tied closely to mortgage rates.”
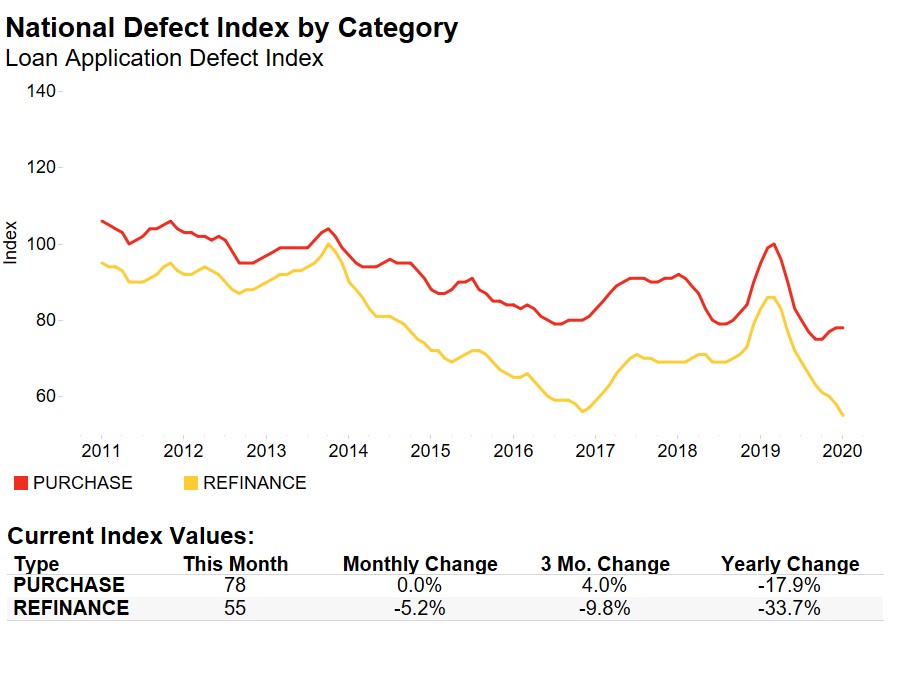
In line with this trend, the Loan Application Defect Index for purchase transactions declined for the first time in eight months, falling 4.0 percent in April compared with the previous month.
The two competing trends that resulted in a flat fraud risk last month were the increasing share of less risky refinance transactions working to decrease overall fraud risk, and the continuation of the hot seller’s market, possibly motivating buyers to misrepresent information in order to qualify for a bigger mortgage and increase overall fraud risk.
The mix of refinance and purchase activity fluctuated within the month of April. Refinance activity increased in the first half of the month as mortgage rates declined. However, lower mortgage rates also fueled an increase in purchase transactions, as buyers took advantage of their increased house-buying power. In fact, purchase applications hit their highest level in nine years towards the end of April. While loan application defects can happen on both purchase or refinance transactions, there is a higher propensity for fraud and misrepresentation with purchase transactions.
Increased Inventory Cools Misrepresentation Pressure
However, the decline in mortgage rates had a third and even more important consequence, which was to help alleviate some of the supply constraints that made the housing market so competitive. As we saw in last month’s report, in extremely competitive markets, there is more motivation to misrepresent information on a loan application to qualify for the bigger mortgage in order to win the bidding war.
Most recently, real estate agents indicate that their buyers are encouraged by an unexpected surge of supply. April did see an increase in total housing inventory, rising to 1.83 million from 1.67 million in March, which is a 1.7% increase year-over-year. Potential buyers feel less inclined to misrepresent information on a loan application when they don’t feel the pressure of a hot sellers’ market. Indeed, misrepresentation of income and employment both fell this month, by 1.7 percent and 3.6 percent respectively.
The future of fraud and misrepresentation risk is tied closely to mortgage rates. Increased inventory reduces competitive pressures and misrepresentation risk, alongside the rising share of lower-risk refinance transactions. It remains to be seen if mortgage rates, now flirting with 4 percent, will go any lower. If so, we may anticipate the continued downward trend in defect risk and misrepresentation, with further increases in refinance transactions and inventory, resulting in less pressure on the market.
The Defect Index is updated monthly with new data. Look for the next edition of the Defect Index the week of June 24, 2019.
April 2019 Loan Application Defect Index
The First American Loan Application Defect Index showed that in April 2019:
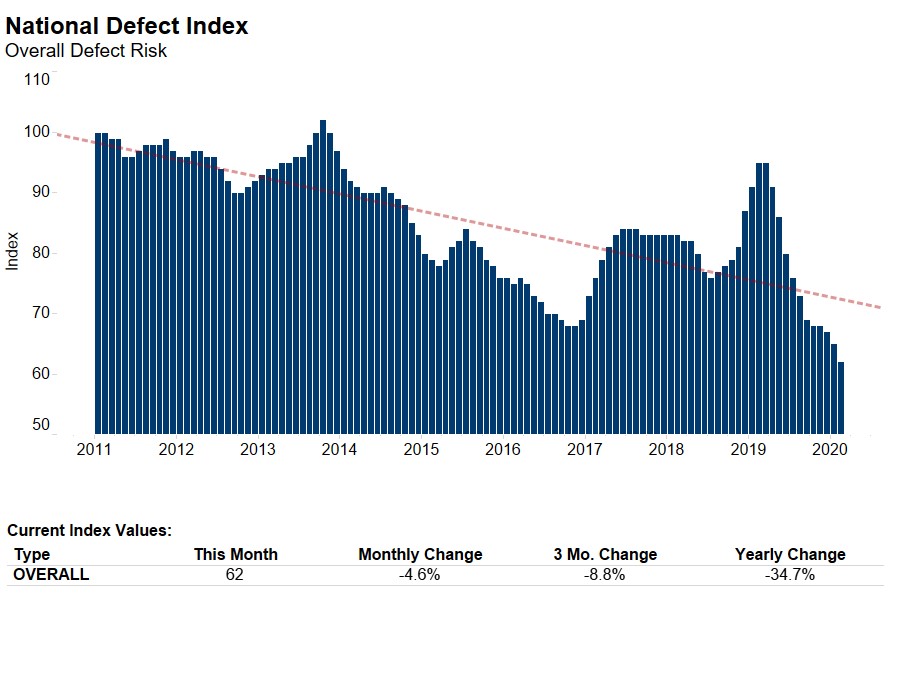
- The frequency of defects, fraudulence and misrepresentation in the information submitted in mortgage loan applications decreased by 4.2 percent compared with the previous month.
- Compared to April 2018, the Defect Index increased by 11.0 percent.
- The Defect Index is down 10.8 percent from the high point of risk in October 2013.
- The Defect Index for refinance transactions decreased by 3.5 percent compared with previous month, and is up 16.9 percent compared with a year ago.
- The Defect Index for purchase transactions decreased by 4.0 percent compared with the previous month, and is up 10.3 percent compared with a year ago.
April 2019 State Highlights
- The five states with a year-over-year increase in defect frequency are: New York (+37.3 percent), Nebraska (+37.0 percent), Iowa (+35.0 percent), Hawaii (+33.7 percent), and West Virginia (+31.1 percent).
- There are two states with the year-over-year decrease in defect frequency: Arkansas (-4.8 percent), and Florida (-1.1 percent).
April 2019 Local Market Highlights
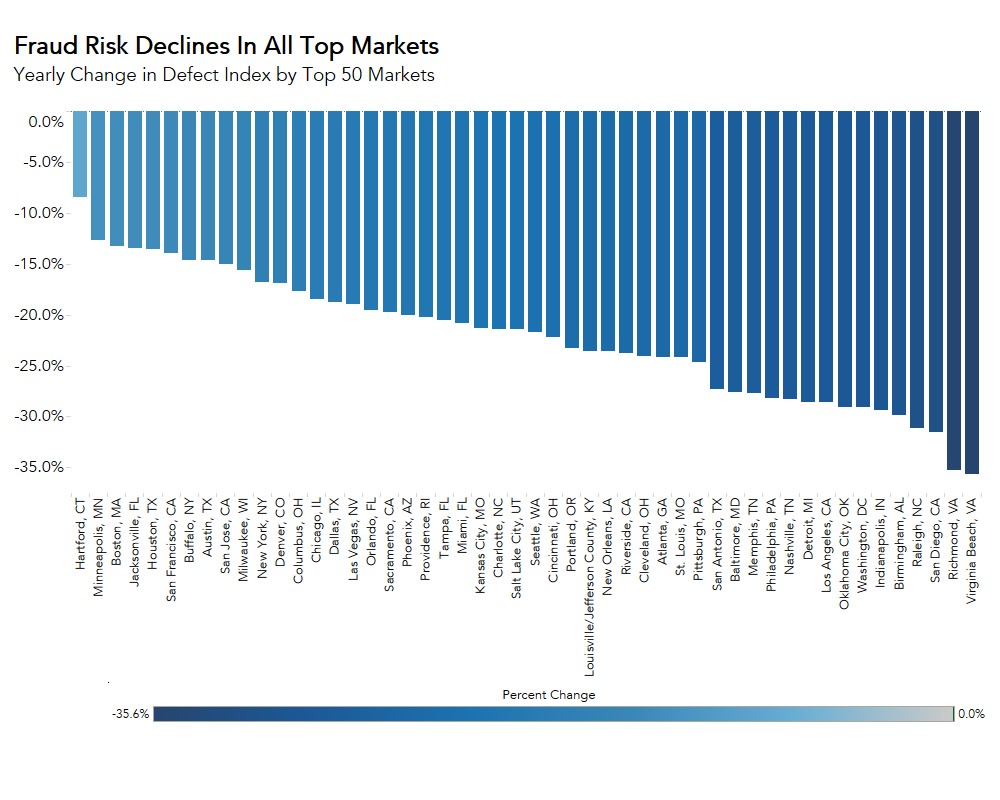
- Among the largest 50 Core Based Statistical Areas (CBSAs), the five markets with the greatest year-over-year increase in defect frequency are: Buffalo, N.Y. (+36.9 percent), Pittsburgh (+31.3 percent), Richmond, Va. (+30.1 percent), Cincinnati (+29.3 percent), and New York (+26.3 percent).
- Among the largest 50 Core Based Statistical Areas (CBSAs), the five markets with year-over-year decrease in defect frequency are: Jacksonville, Fla. (-11.6 percent), Houston (-8.5 percent), Orlando, Fla. (-7.4 percent), San Diego (-4.3 percent), and Miami (-2.0 percent).
Methodology
The First American Loan Application Defect Index estimates the level of defects detected in the information submitted in mortgage loan applications processed by the First American FraudGuard® system. The index is based on the frequency with which defect indicators are identified. The Defect Index moves higher as greater numbers of defect indicators are identified. An increase in the index indicates a rising level of loan application defects. The index, nationally and in all markets, is benchmarked to a value of 100 in January 2011. Therefore, all index values can be interpreted as the percentage change in defect frequency relative to the defect frequency identified nationally in January 2011.