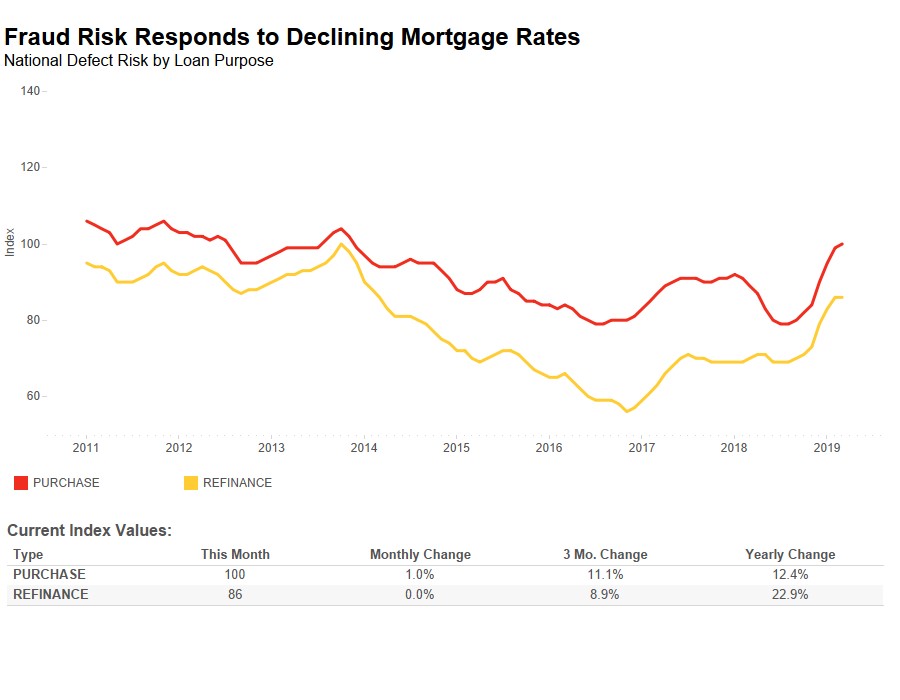
Loan application defect risk for purchase transactions continued its upward trend in March, increasing 1.0 percent month-over-month, according to the Loan Application Defect Index. Defect risk for purchase transactions has risen for seven consecutive months, however, the pace of growth slowed to its lowest point over that time span. Overall, the frequency of defects, fraudulence and misrepresentation in the information submitted in mortgage loan applications remained the same compared to the previous month, ending the trend of increasing risk that started in July 2018. But, what could be driving this change?
“Sellers’ market conditions increased fraud risk, but the rising share of lower-risk refinance transactions reduced fraud risk.”
Colliding Trends Slow Defect Risk Growth
Nationally, defect risk continued to surge in early 2019 and in February reached its highest point since 2013. Suddenly in March, the acceleration stopped. Two recent trends influenced defect risk in opposite directions and drove the moderation in defect risk:
- Rising Share of Refinance Transactions: In 2018, mortgage rates steadily increased, reaching a high of 4.9 percent in November, before reversing course in December. Mortgage rates have been declining ever since, reaching 4.27 percent in March, 0.17 percentage points lower than one year ago. As mortgage rates fall, the incentive to refinance increases. In the first quarter of 2019, the share of refinance mortgage transactions increased to 32 percent of the overall mortgage market , a 5 percent increase over the prior quarter. While loan application defects can happen on either purchase or refinance transactions, there is a lower propensity for fraud and misrepresentation with refinance transactions. So, as the share of lower-risk refinance transactions increases, overall fraud risk tends to decline.
- Sellers’ Market Continues: While declining mortgage rates spurred refinance activity, they’ve also encouraged potential home buyers to return to the market. In the first quarter of 2019, declining mortgage rates, ongoing household income growth and moderating unadjusted home prices boosted affordability. Yet, the increased demand for housing is occurring in a supply-constrained market, resulting in another sellers’ market this spring. In these competitive conditions, there is more motivation to misrepresent information on a loan application to qualify for the bigger mortgage necessary to win the bidding war for a home. In fact, employment misrepresentation increased 2.9 percent compared with the previous month.
End Result: Defect Risk Stabilizes
The two competing trends stabilized the risk of defects, fraud and misrepresentation in March. Sellers’ market conditions increased fraud risk, but the rising share of lower-risk refinance transactions reduced fraud risk. The tug-of-war between the hot sellers’ market and the mix of refinance and purchase transactions will heavily influence the direction of fraud risk in the months ahead.
The Defect Index is updated monthly with new data. Look for the next edition of the Defect Index the week of May 27, 2019.
March 2019 Loan Application Defect Index
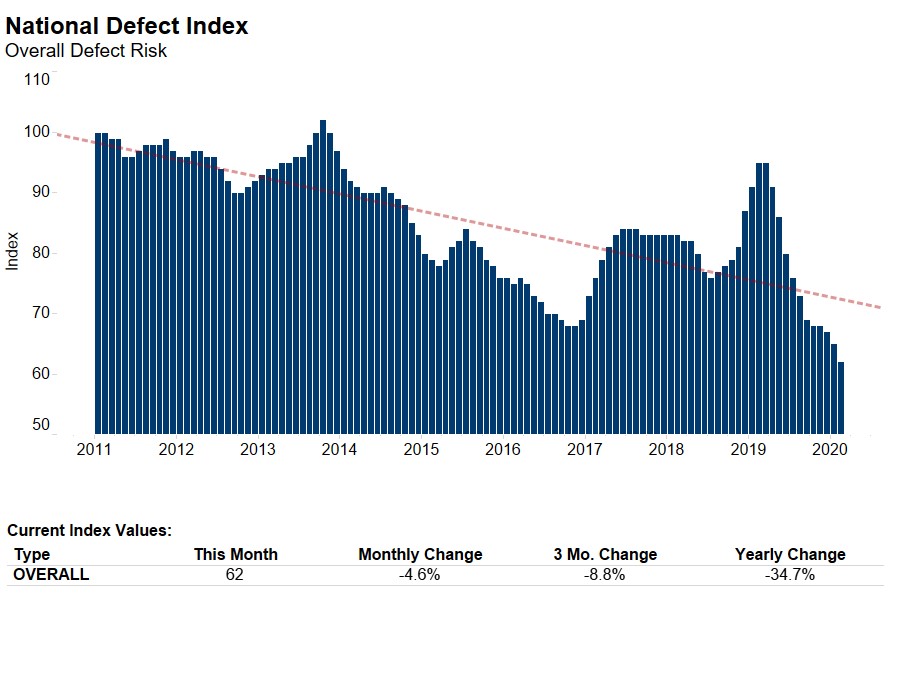
The First American Loan Application Defect Index showed that in March 2019:
- The frequency of defects, fraudulence and misrepresentation in the information submitted in mortgage loan applications remained unchanged compared with the previous month.
- Compared to March 2018, the Defect Index increased by 15.9 percent.
- The Defect Index is down 6.8 percent from the high point of risk in October 2013.
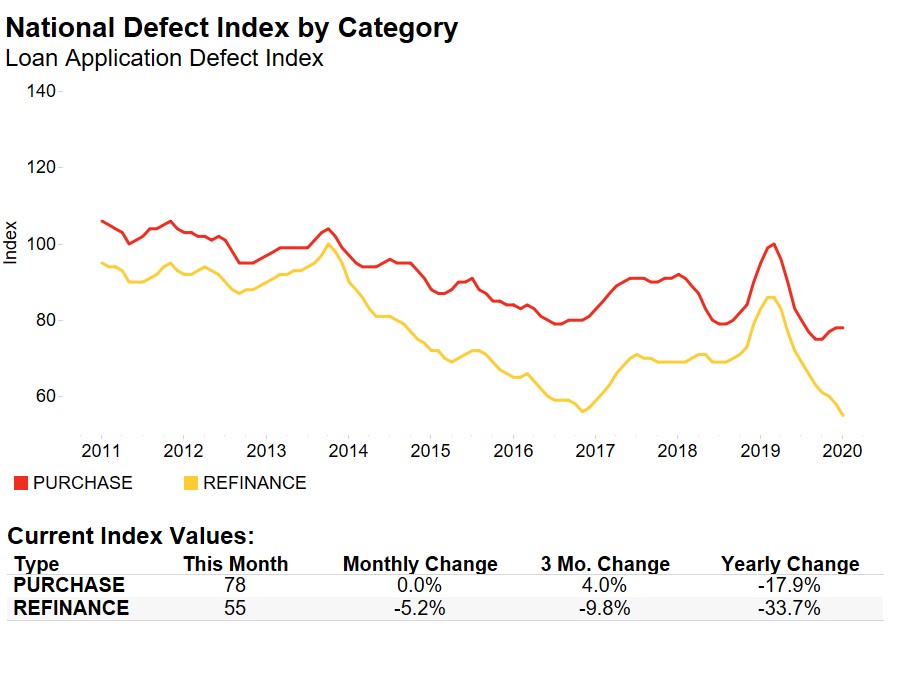
- The Defect Index for refinance transactions remained the same compared with previous month, and is up 22.9 percent compared with a year ago.
- The Defect Index for purchase transactions increased by 1.0 percent compared with the previous month, and is up 12.4 percent compared with a year ago.
March 2019 State Highlights
- The five states with a year-over-year increase in defect frequency are: Nebraska (+41.9 percent), New York (+41.3 percent), Iowa (+39.5 percent), West Virginia (+37.8 percent), and Maine (+36.2 percent).
- There is one state with a year-over-year decrease in defect frequency: Arkansas (-0.9 percent).
March 2019 Local Market Highlights
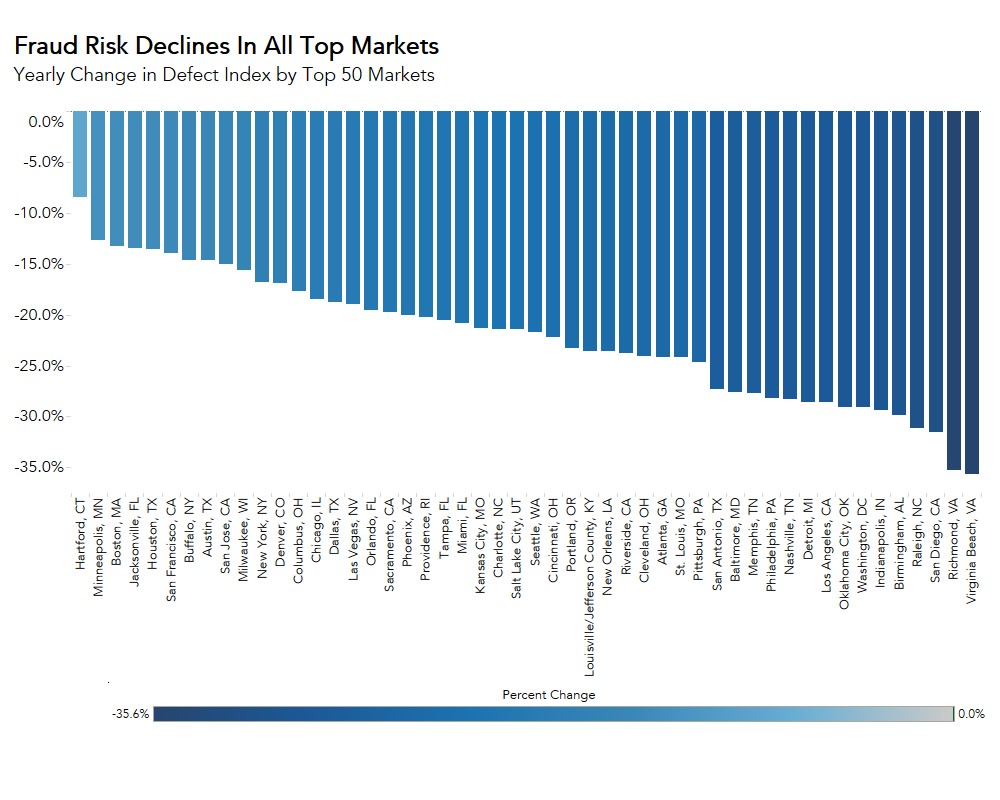
- Among the largest 50 Core Based Statistical Areas (CBSAs), the five markets with the greatest year-over-year increase in defect frequency are: Buffalo, N.Y. (+40.6 percent), Richmond, Va. (+40.3 percent), Pittsburgh (+33.8 percent), Raleigh, N.C. (+32.1 percent), and Cincinnati (+31.6 percent).
- Among the largest 50 Core Based Statistical Areas (CBSAs), the three markets with a year-over-year decrease in defect frequency are: Jacksonville, Fla. (-9.4 percent), Orlando, Fla. (-6.4 percent), and Houston (-5.3 percent).
Deputy Chief Economist Odeta Kushi contributed to this post.