In September 2022, the Real House Price Index (RHPI) jumped up by 60.6 percent on an annual basis. This rapid annual decline in affordability was driven by two factors – a 13.5 percent annual increase in nominal house prices and a 3.2 percentage point increase in the average 30-year, fixed mortgage rate compared with one year ago. Even though household income increased 3.1 percent since September 2021 and boosted consumer house-buying power, it was not enough to offset the affordability loss from higher mortgage rates and fast-rising nominal prices. As affordability wanes and prompts buyers to pull back from the market, nominal house price appreciation has slowed. Nationally, annual nominal house price growth peaked in March at nearly 21 percent but has since decelerated by approximately 7 percentage points to 13.5 percent in September.
“Potential home sellers gained significant amounts of equity over the pandemic, so even as affordability-constrained buyer demand spurs price declines in some markets, potential sellers are unlikely to lose all that they have gained.”
But real estate is local, and there are markets where annual price growth isn’t just slowing, but prices are falling from recent peaks. Nominal house prices in many markets are poised to fall further as the hot sellers’ market of the pandemic turns in favor of buyers, but not all that was gained in the pandemic will necessarily be lost.
Not All that was Gained Will be Lost
The pandemic housing market was unprecedented in multiple ways. The housing market was already strong prior to 2020, yet the pandemic redefined the role of a home, creating a surge in demand. As work-from-home became the new normal, a house was no longer just a dwelling or a vehicle for wealth creation, but also an office, a classroom, a daycare and even a gym. The broadening role of the home in American life, coupled with record-low mortgage rates and limited housing supply, powered the housing market to multiple records during this unprecedented time -- the fastest annual house price appreciation, the lowest days on market in the history of record-keeping, and a near-record annualized pace of sales. Yet the pandemic housing market was the exception, not the norm. Double-digit house price growth was not sustainable in the long run. As the saying goes, what goes up, must ‘eventually’ come down. Sellers may be anchored to yesterday’s prices, but buyers won’t buy unless sellers adjust prices down to meet the affordability-constraining reality of higher mortgages rates. Sellers are beginning to recognize this and price cuts are becoming more common.
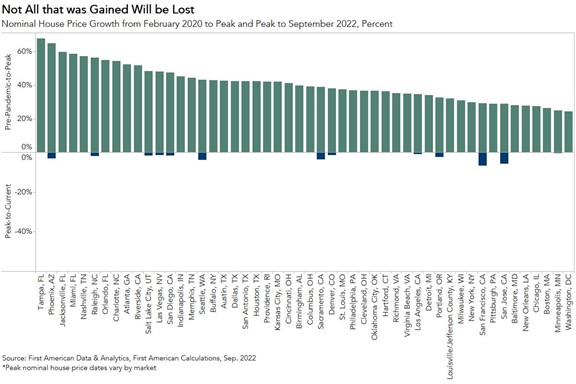
Nominal house prices declined in September from their recent peaks in 15 of the top 50 markets we track. The market with the biggest decline was San Francisco, where nominal house prices peaked in March 2022, but have since declined by 6.8 percent as the housing market rebalances. San Jose follows closely behind, as nominal house prices have declined 5.9 percent from the recent peak in April 2022.
While prices are declining from the peak in these markets, much of the homeowner equity gained during the pandemic remains. For example, in both San Francisco and San Jose, house prices increased 29 percent from February 2020 to their respective peaks in 2022. House price declines would have to be substantial to eat away at all the equity that many homeowners have accumulated over the last few years.
Rebalancing is Healthy
House-buying power has declined by $145,500 compared with one year ago, primarily due to higher mortgage rates. Affordability will likely remain a drag on the housing market until house-buying power recovers as house prices decline. House prices have already begun to adjust to the reality of higher mortgage rates in many markets, which will help bring more balance to the housing market heading into 2023. Potential home sellers gained significant amounts of equity over the pandemic, so even as affordability-constrained buyer demand spurs price declines in some markets, potential sellers are unlikely to lose all that they have gained.
For more analysis of affordability, please visit the Real House Price Index. The RHPI is updated monthly with new data. Look for the next edition of the RHPI the week of December 26, 2022.
Sources:
September 2022 Real House Price Index Highlights
The First American Real House Price Index (RHPI) showed that in September 2022:
- Real house prices increased 10.5 percent between August 2022 and September 2022.
- Real house prices increased 60.6 percent between September 2021 and September 2022.
- Consumer house-buying power, how much one can buy based on changes in income and interest rates, decreased 8.9 percent between August 2022 and September 2022, and decreased 29.3 percent year over year.
- Median household income has increased 3.1 percent since September 2021 and 77 percent since January 2000.
- Real house prices are 38.1 percent more expensive than in January 2000.
- While unadjusted house prices are now 55.4 percent above the housing boom peak in 2006, real, house-buying power-adjusted house prices remain 2.5 percent below their 2006 housing boom peak.
September 2022 Real House Price State Highlights
- The five states with the greatest year-over-year increase in the RHPI are: Florida (+78.3), Georgia (+66.9), Arkansas (+65.8), South Carolina (+64.9 percent), and Alabama (+64.7 percent).
- There were no states with a year-over-year decrease in the RHPI.
September 2022 Real House Price Local Market Highlights
- Among the Core Based Statistical Areas (CBSAs) tracked by First American, the five markets with the greatest year-over-year increase in the RHPI are: Miami (+82.5 percent), Tampa, Fla. (+73.4 percent), Indianapolis (+70.4 percent), Nashville, Tenn. (+69.6), and Orlando, Fla. (+69.3 percent).
- Among the Core Based Statistical Areas (CBSAs) tracked by First American, there were no markets with a year-over-year decrease in the RHPI.
About the First American Real House Price Index
The traditional perspective on house prices is fixated on the actual prices and the changes in those prices, which overlooks what matters to potential buyers - their purchasing power, or how much they can afford to buy. First American’s proprietary Real House Price Index (RHPI) adjusts prices for purchasing power by considering how income levels and interest rates influence the amount one can borrow.
The RHPI uses a weighted repeat-sales house price index that measures the price movements of single-family residential properties by time and across geographies, adjusted for the influence of income and interest rate changes on consumer house-buying power. The index is set to equal 100 in January 2000. Changing incomes and interest rates either increase or decrease consumer house-buying power. When incomes rise and mortgage rates fall, consumer house-buying power increases, acting as a deflator of increases in the house price level. For example, if the house price index increases by three percent, but the combination of rising incomes and falling mortgage rates increase consumer buying power over the same period by two percent, then the Real House Price index only increases by 1 percent. The Real House Price Index reflects changes in house prices, but also accounts for changes in consumer house-buying power.
Disclaimer
Opinions, estimates, forecasts and other views contained in this page are those of First American’s Chief Economist, do not necessarily represent the views of First American or its management, should not be construed as indicating First American’s business prospects or expected results, and are subject to change without notice. Although the First American Economics team attempts to provide reliable, useful information, it does not guarantee that the information is accurate, current or suitable for any particular purpose. © 2022 by First American. Information from this page may be used with proper attribution.


