Two of the three key drivers of the Real House Price Index (RHPI), household income and mortgage rates, modestly swung in favor of increased affordability in September, yet affordability declined month over month. The 30-year, fixed-rate mortgage fell by 0.01 percentage points and household income increased 0.03 percent compared with August 2019. When household income rises, consumer house-buying power increases. Declining mortgage rates have a similar impact on consumer house-buying power.
“Affordability trends are influenced by shifts in house-buying power and nominal home price appreciation. A shift in one or the other is not sufficient to know whether affordability has increased or decreased."
However, nominal house price appreciation jumped 1.1 percent in September, outpacing the benefits of rising house-buying power on affordability. Accordingly, the RHPI increased 0.9 percent month over month. Increases in the RHPI indicate a decline in affordability, and September’s decline in affordability was the largest month-over-month affordability decline since November 2018. In 2019, declining mortgage rates have increased house-buying power, fueling greater demand. However, when demand increases for a scarce (limited or low supply) good, prices will rise faster. While year-over-year, the RHPI shows an improvement in affordability, the increase in house-buying power in September was not enough to offset nominal house price gains compared with August.
The Five Cities Where Affordability Decreased the Most
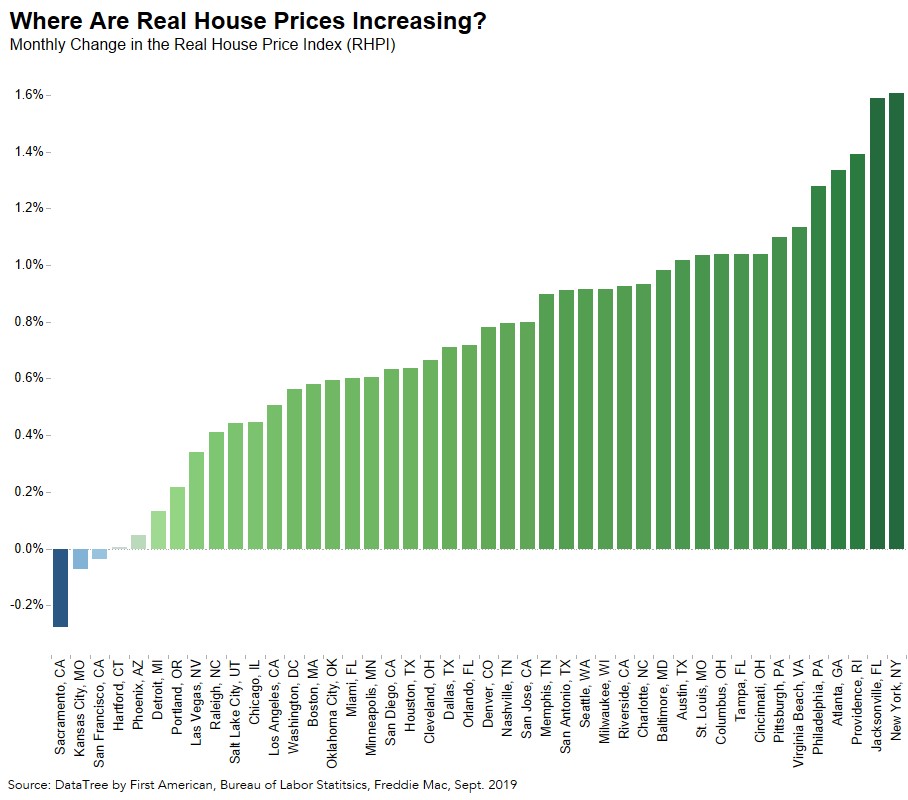
As the old adage goes, real estate is all about “location, location, location.” Of the 44 markets we track, the RHPI increased in 41 of them month over month, meaning affordability declined in each. The rise in the RHPI is a break from the long-term trend in 2019, as all of these markets are significantly more affordable than they were one year ago. Nevertheless, the five markets with the greatest month-over-month increases in the RHPI and thus the greatest declines in affordability were:
|
|
|
||
|
City |
House-Buying Power |
Nominal House Price Index |
RHPI |
|
1.) New York, NY |
-0.31% |
1.29% |
1.61% |
|
2.) Jacksonville, FL |
-0.45% |
1.59% |
1.59% |
|
3.) Providence, RI |
0.84% |
2.24% |
1.39% |
|
4.) Atlanta, GA |
0.16% |
1.50% |
1.34% |
|
5.) Philadelphia, PA |
0.69% |
1.98% |
1.28% |
Affordability declined the most month-over-month in New York City, where the RHPI increased by 1.61 percent. Nominal house prices increased by 1.29 percent, and house-buying power declined by 0.31 percent. Notice that nominal house price appreciation in New York City was less than in some other cities, but the combination with the decline in house-buying power led New York City to top the list in the loss of affordability. Nominal house price appreciation grew fastest in Providence, yet the city was third on the list for monthly increase in RHPI and thus decreased affordability. The month-over-month increase in house-buying power in Providence helped mitigate the negative impact from faster house price appreciation on affordability.
One month does not make a trend, yet these markets demonstrate the dynamic we expected to see – the consistent growth in house-buying power over 2019 has boosted demand in a supply constrained market, putting upward pressure on house price appreciation. Faster nominal house price appreciation can erode, or even completely eliminate, the boost in affordability from increasing house-buying power. Affordability trends are influenced by shifts in house-buying power and nominal home price appreciation. A shift in one or the other is not sufficient to know whether affordability has increased or decreased. The question for 2020 is, where does house-buying power go from here?
For more analysis of affordability, please visit the Real House Price Index. The RHPI is updated monthly with new data. Look for the next edition of the RHPI the week of December 30, 2019.
Sources:
September 2019 Real House Price Index Highlights
The First American Real House Price Index (RHPI) showed that in September 2019:
- Real house prices increased 0.9 percent between August 2019 and September 2019.
- Real house prices declined 7.6 percent between September 2018 and September 2019.
- Consumer house-buying power, how much one can buy based on changes in income and interest rates, increased 0.2 percent between August 2019 and September 2019, and increased 15.8 percent year over year.
- Median household income has increased 2.5 percent since September 2018 and 57.7 percent since January 2000.
- Real house prices are 18.8 percent less expensive than in January 2000.
- While unadjusted house prices are now 8.1 percent above the housing boom peak in 2006, real, house-buying power-adjusted house prices remain 42.2 percent below their 2006 housing boom peak.
September Real House Price State Highlights
- There are no states with a year-over-year increase in the RHPI.
- The five states with the greatest year-over-year decrease in the RHPI are: New Mexico (-12.1 percent), California (-10.4 percent), Colorado (-9.6 percent), Wyoming (-9.4 percent), and Utah (-9.3 percent).
September 2019 Real House Price Local Market Highlights
- Among the Core Based Statistical Areas (CBSAs) tracked by First American, there are no markets with a year-over-year increase in the RHPI.
- Among the Core Based Statistical Areas (CBSAs) tracked by First American, the five markets with the greatest year-over-year decrease in the RHPI are: San Jose, Calif. (-15.0 percent), San Francisco (-12.4 percent), Portland, Ore. (-11.3 percent), Los Angeles (-10.4 percent), and Denver (-10.3 percent).
About the First American Real House Price Index
The traditional perspective on house prices is fixated on the actual prices and the changes in those prices, which overlooks what matters to potential buyers - their purchasing power, or how much they can afford to buy. First American’s proprietary Real House Price Index (RHPI) adjusts prices for purchasing power by considering how income levels and interest rates influence the amount one can borrow.
The RHPI uses a weighted repeat-sales house price index that measures the price movements of single-family residential properties by time and across geographies, adjusted for the influence of income and interest rate changes on consumer house-buying power. The index is set to equal 100 in January 2000. Changing incomes and interest rates either increase or decrease consumer house-buying power. When incomes rise and mortgage rates fall, consumer house-buying power increases, acting as a deflator of increases in the house price level. For example, if the house price index increases by three percent, but the combination of rising incomes and falling mortgage rates increase consumer buying power over the same period by two percent, then the Real House Price index only increases by 1 percent. The Real House Price Index reflects changes in house prices, but also accounts for changes in consumer house-buying power.
Disclaimer
Opinions, estimates, forecasts and other views contained in this page are those of First American’s Chief Economist, do not necessarily represent the views of First American or its management, should not be construed as indicating First American’s business prospects or expected results, and are subject to change without notice. Although the First American Economics team attempts to provide reliable, useful information, it does not guarantee that the information is accurate, current or suitable for any particular purpose. © 2019 by First American. Information from this page may be used with proper attribution.


