In December, the market potential for existing-home sales in December increased 1.1 percent to a seasonally adjusted annualized rate of 6.15 million compared with a year ago, but the housing market still underperformed its potential by 9.6 percent, according to our Potential Homes Sales Model. Month over month, the gap between actual existing-home sales and the market potential for home sales narrowed by 2.1 percent, but the housing market still has the potential to support more than 593,000 additional home sales at a seasonally adjusted annualized rate (SAAR).
“The decline in mortgage rates is a welcome relief to prospective home buyers who have mostly experienced a year of rising rates and house prices.”
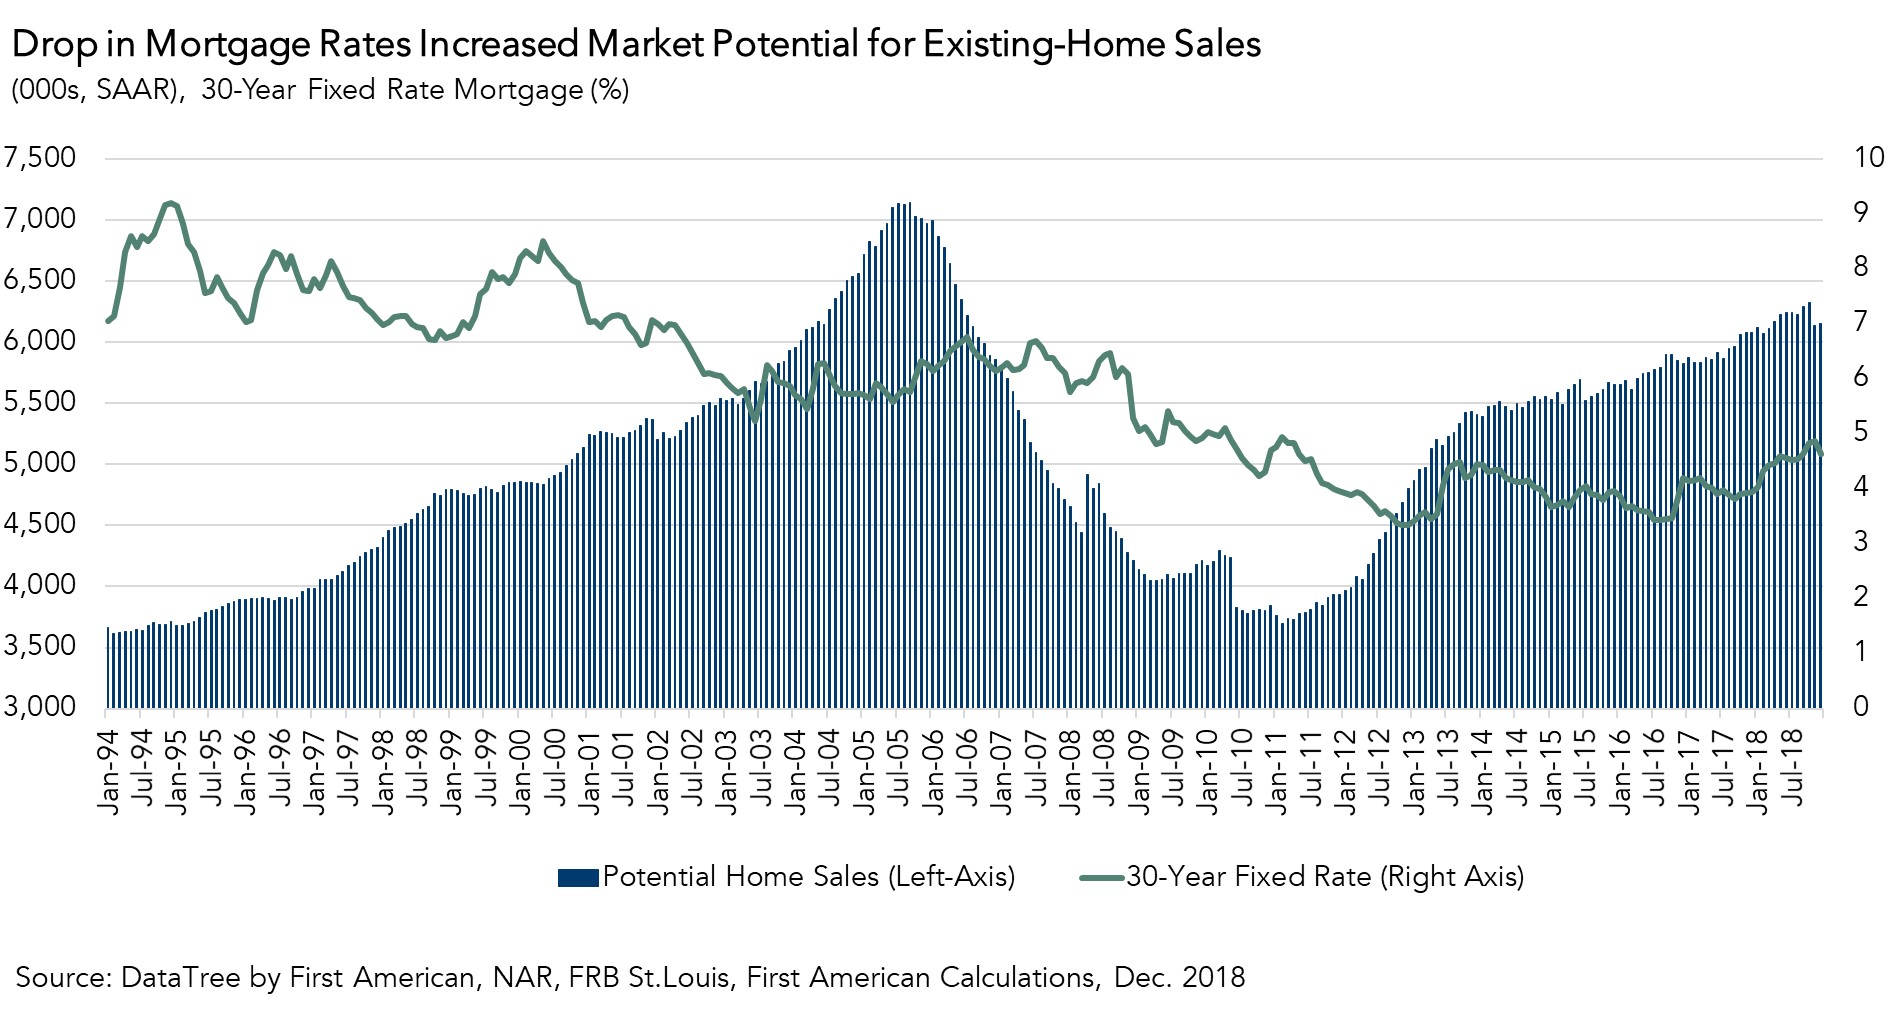
Rising Mortgage Rates Impact Both Existing Homeowners and First-Time Home Buyers
The housing market has experienced a decades-long decline in the 30-year, fixed mortgage rate, dropping from a high of 18 percent in 1981 to a low of nearly 3 percent in 2012. This long-run decline increased affordability and encouraged existing homeowners to move. However, in 2016, the trend reversed, and mortgage rates began to slowly increase, reaching nearly 5 percent last November.
This period of rising rates has dissuaded existing homeowners from selling their home – why move when it will cost more each month to borrow the same amount from the bank? Additionally, rising rates have reduced affordability in some high-cost markets, discouraging some potential first-time home buyers from entering the market. So, rising mortgage rates discourage both existing homeowners and some first-time home buyers from entering the market.
How Stock Market Volatility Helps Home Buyers
While mortgage rates are expected to continue to rise in 2019, last month’s stock market volatility has reversed the recent upward trend of mortgage rates. It’s often overlooked that the popular 30-year, fixed-rate mortgage is closely tied to the 10-year Treasury bond. When the economy is doing well, investors prioritize investing in securities over bonds, driving higher longer-term Treasury yields, which also tends to increase mortgage rates.
In December, the opposite happened. A steep sell-off in U.S. stocks caused by investors seeking safe-haven from global and domestic economic uncertainty caused the 10-year Treasury yield to decline, and mortgage rates fell alongside it. In fact, the average 30-year, fixed-rate mortgage in December fell 23 basis points compared with the previous month. The decline in mortgage rates is a welcome relief to prospective home buyers who have mostly experienced a year of rising rates and house prices. The December drop in mortgage rates increased the market potential for existing-home sales by 0.3 percent.
Should Home Buyers Root for Uncertainty in Stock Market?
According to Freddie Mac, last week’s 30-year, fixed-rate mortgage dropped further to 4.45 percent. If January ends with an average mortgage rate of 4.5 percent, 14 basis points lower than December’s average of 4.64, we expect the market potential for existing-home sales to increase by nearly 7,000 sales. This is not surprising, given existing homeowners that were previously financially “imprisoned” in their home can now feel more comfortable about entering the market, and first-time home buyers benefit from increased affordability.
While we don’t expect falling mortgage rates to be the norm in 2019, the recent drop has benefited potential home buyers. In the face of falling mortgage rates, mortgage applications for the week ending January 4 jumped more than 20 percent from the previous week, even during the slower than usual holiday period. Uncertainty regarding world economic events and global trade agreements may lead to a further sell-off in equity markets, adding more downward pressure on mortgage rates. If this occurs, we can expect the market potential for existing-home sales to rise further.
December 2018 Potential Home Sales
For the month of December, First American updated its proprietary Potential Home Sales Model to show that:
- Potential existing-home sales increased marginally to a 6.15 million seasonally adjusted annualized rate (SAAR), a 0.3 percent month-over-month increase.
- This represents a 64.7 percent increase from the market potential low point reached in February 2011.
- The market potential for existing-home sales increased by 1.1 percent compared with a year ago, a gain of 69,000 (SAAR) sales.
- Currently, potential existing-home sales is 1.1 million (SAAR), or 15.6 percent below the pre-recession peak of market potential, which occurred in July 2005.
Market Performance Gap
- The market for existing-home sales is underperforming its potential by 9.6 percent or an estimated 593,000 (SAAR) sales.
- The market performance gap decreased by an estimated 129,000 (SAAR) sales between November 2018 and December 2018.
What Insight Does the Potential Home Sales Model Reveal?
When considering the right time to buy or sell a home, an important factor in the decision should be the market’s overall health, which is largely a function of supply and demand. Knowing how close the market is to a healthy level of activity can help consumers determine if it is a good time to buy or sell, and what might happen to the market in the future. That is difficult to assess when looking at the number of homes sold at a particular point in time without understanding the health of the market at that time. Historical context is critically important. Our potential home sales model measures what we believe a healthy market level of home sales should be based on the economic, demographic and housing market environments.
About the Potential Home Sales Model
Potential home sales measures existing-homes sales, which include single-family homes, townhomes, condominiums and co-ops on a seasonally adjusted annualized rate based on the historical relationship between existing-home sales and U.S. population demographic data, income and labor market conditions in the U.S. economy, price trends in the U.S. housing market, and conditions in the financial market. When the actual level of existing-home sales are significantly above potential home sales, the pace of turnover is not supported by market fundamentals and there is an increased likelihood of a market correction. Conversely, seasonally adjusted, annualized rates of actual existing-home sales below the level of potential existing-home sales indicate market turnover is underperforming the rate fundamentally supported by the current conditions. Actual seasonally adjusted annualized existing-home sales may exceed or fall short of the potential rate of sales for a variety of reasons, including non-traditional market conditions, policy constraints and market participant behavior. Recent potential home sale estimates are subject to revision to reflect the most up-to-date information available on the economy, housing market and financial conditions. The Potential Home Sales model is published prior to the National Association of Realtors’ Existing-Home Sales report each month.

.jpg)
