Key Points:
- Affordability improved nearly 11 percent year over year in January, reaching its highest level since August 2022.
- Income growth has outpaced house price growth for 19 straight months, boosting house-buying power even as mortgage rates remain elevated.
- Markets with declining home prices had the largest affordability gains, while areas with continued price growth and weaker income gains lagged.
Affordability began 2026 on its strongest footing since August 2022. In January, the First American Data & Analytics Real House Price Index (RHPI) shows affordability improved nearly 11 percent compared with a year ago. The improvement in affordability reflects a favorable combination of factors -- mortgage rates were 0.9 percentage points lower than a year ago, nominal house price growth nationally slowed to 0.6 percent, and household income increased by 3.1 percent. Notably, income growth has outpaced house price growth for 19 consecutive months.
The affordability gains were widespread. All 50 states and 99 of the top 100 markets1 posted annual improvements in affordability. While affordability remains more than 60 percent below its pre-pandemic five-year average, the recent progress offers a meaningful reprieve for prospective home buyers. Even so, the strength of affordability gains varies across markets.
“Affordability trends move based on the interplay between mortgage rates, home prices and household incomes, and how those forces differ across local markets."
Why Is Affordability Improving Faster in Some Markets?
Mortgage rate changes are largely consistent across the country, so differences in affordability tend to be driven by local conditions, particularly home price movements and income growth. The markets with the largest affordability gains tend to share one key characteristic: declining nominal house prices.
Cape Coral, Fla., stands out as the most improved among the top 100 markets, with affordability up more than 17 percent year over year. The boost in affordability was driven primarily by a 9 percent decline in nominal house prices, the largest decline among the top 100 markets, while income growth remained relatively modest. Sarasota, Fla., shows a similar pattern, with prices falling nearly 6 percent — also among the largest declines — and affordability improving by more than 16 percent, supported in part by stronger income growth.
These declines in house prices follow an extraordinary run-up during the pandemic-era housing boom. In Cape Coral, prices nearly doubled from February 2020 to their peak in 2024 and have since fallen about 17 percent, bringing them back to roughly 2022 levels. In Sarasota, prices increased more than 70 percent from February 2020 to their peak in 2023 and have declined about 15 percent, returning to approximately 2021 levels. Shifting demand, rising inventory and higher insurance costs, particularly in parts of Southwest Florida, have contributed to more pronounced price adjustments.
Other markets follow a similar, though less severe, pattern. In Denver, and Las Vegas, price declines of roughly 3 to 4 percent, combined with steady income growth, have produced strong affordability gains. Tampa, Fla. and Miami, also posted notable improvements, as modest price declines were paired with solid income growth.
There are also examples where income growth played a larger role in the improvement in affordability. In Atlanta, affordability improved by more than 16 percent despite only modest price declines, supported by nearly 7 percent income growth.
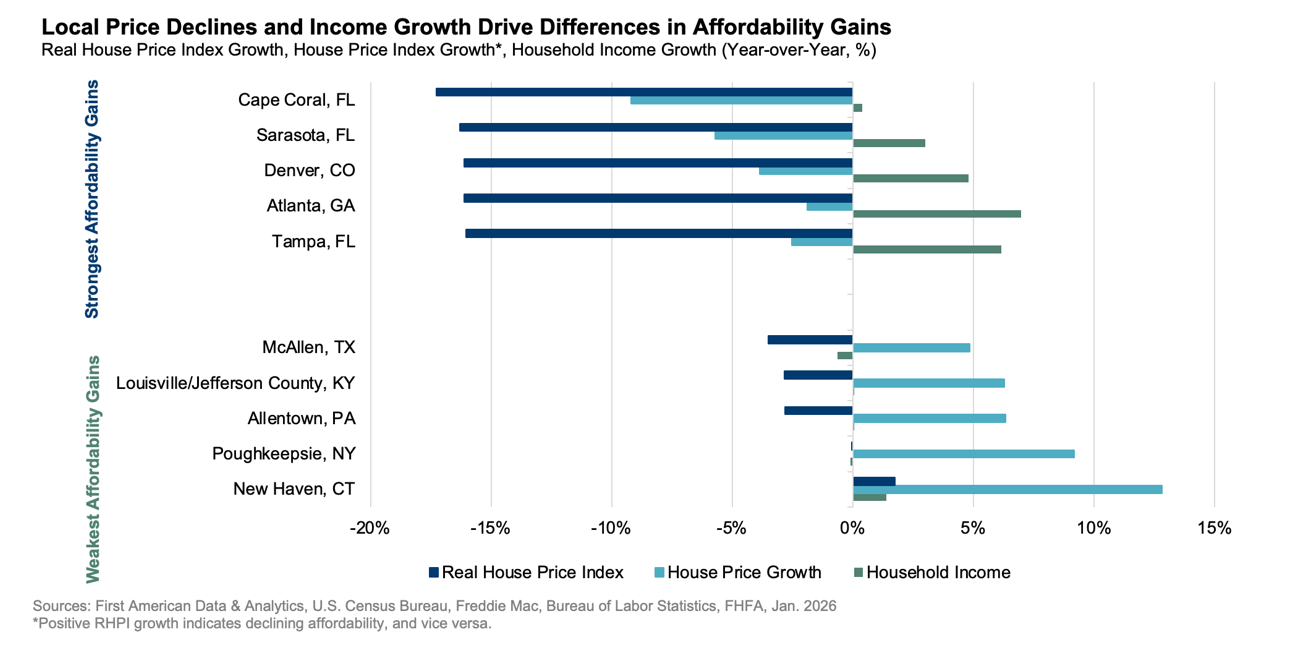
At the other end of the spectrum are places where affordability has improved only modestly or, in some cases, declined. In McAllen, Texas, Louisville, Ky., and Allentown, Pa., house prices continue to rise between 5 and 6 percent annually, while income growth has been flat or negative. As a result, affordability gains in these areas have been limited. New Haven, Conn., stands out as the only market where affordability declined year over year, with house prices rising nearly 13 percent.
Affordability’s Path Forward Depends on More Than Rates
Although affordability has improved over the past year, the outlook is more uncertain. Mortgage rates have recently moved higher, driven by geopolitical uncertainty and rising energy costs that are contributing to inflation concerns. The uptick in mortgage rates is likely to blunt improvement in affordability. However, affordability is not determined by mortgage rates alone. Income growth and house price trends remain critical. If price growth stays subdued, or declines continue in some markets, and incomes keep rising, those factors can help offset, or at least mitigate, the impact of higher mortgage rates. Ultimately, affordability is determined by the interplay between mortgage rates, home prices and household incomes, and how those forces evolve across local markets.
Sources:
• First American Data & Analytics
• Freddie Mac
• Census Bureau
January 2026 Real House Price Index Highlights
The First American Data & Analytics’ Real House Price Index (RHPI) showed that in January 2026:
- Real house prices decreased 1.2 percent between December 2025 and January 2026.
- Real house prices decreased 10.8 percent between January 2025 and January 2026.
- Consumer house-buying power, how much one can buy based on changes in income and mortgage rates, increased 1.2 percent between December 2025 and January 2026, and increased 12.7 percent year over year.
- Median household income has increased 3.1 percent since January 2025 and 50.2 percent since January 2016.
- Real house prices are 27.2 percent more expensive than in January 2000.
- Unadjusted house prices are now 65.9 percent above the housing boom peak in 2006, while real, house-buying power-adjusted house prices are 10.0 percent below their 2006 housing boom peak.
January 2026 Real House Price State Highlights
- There were no states with a year-over-year increase in the RHPI.
- The five states with the greatest year-over-year decrease in the RHPI are: Georgia (-16.5 percent), Florida (-15.8 percent), Nevada (-14.4 percent), Washington (-14.1 percent), and Colorado (-12.6 percent).
January 2026 Real House Price Local Market Highlights
- Among the Core Based Statistical Areas (CBSAs) tracked by First American Data & Analytics, the only market with a year-over-year increase in the RHPI is: New Haven, Conn. (+1.8 percent).
- Among the Core Based Statistical Areas (CBSAs) tracked by First American Data & Analytics, the five markets with the greatest year-over-year decrease in the RHPI are: Cape Coral, Fla. (-17.3 percent), Sarasota, Fla. (-16.3 percent), Atlanta (-16.1 percent), Denver (-16.1 percent), and Tampa Fla. (-16.0 percent).
Next Release
The next release of the First American Data & Analytics’ Real House Price Index will take place the week of April 27, 2026.
About the First American Data & Analytics’ Real House Price Index
The traditional perspective on house prices is fixated on the actual prices and the changes in those prices, which overlooks what matters to potential buyers - their purchasing power, or how much they can afford to buy. First American Data & Analytics’ proprietary Real House Price Index (RHPI) adjusts prices for purchasing power by considering how income levels and interest rates influence the amount one can borrow.
The RHPI uses a weighted repeat-sales house price index that measures the price movements of single-family residential properties by time and across geographies, adjusted for the influence of income and interest rate changes on consumer house-buying power. The index is set to equal 100 in January 2000. Changing incomes and interest rates either increase or decrease consumer house-buying power. When incomes rise and mortgage rates fall, consumer house-buying power increases, acting as a deflator of increases in the house price level. For example, if the house price index increases by three percent, but the combination of rising incomes and falling mortgage rates increase consumer buying power over the same period by two percent, then the Real House Price index only increases by 1 percent. The Real House Price Index reflects changes in house prices, but also accounts for changes in consumer house-buying power.
Disclaimer
Opinions, estimates, forecasts and other views contained in this page are those of First American’s Chief Economist, do not necessarily represent the views of First American or its management, should not be construed as indicating First American’s business prospects or expected results, and are subject to change without notice. Although the First American Economics team attempts to provide reliable, useful information, it does not guarantee that the information is accurate, current or suitable for any particular purpose. © 2026 by First American. Information from this page may be used with proper attribution.
[1] This month’s RHPI reflects an updated methodology and expanded coverage to include the top 100 markets, providing a more comprehensive view of local affordability conditions.


