Housing affordability declined on a year-over-year basis for the third month in a row in May, following a two-year streak of rising affordability. The decline in May occurred even as two of the three key drivers of the Real House Price Index (RHPI), household income and mortgage rates, swung in favor of greater affordability relative to one year ago.
“Affordability trends in the coming months will hinge on the supply and demand dynamics behind nominal house price appreciation – dynamics which will play out differently in each market.”
House-buying power increased by 8 percent in May compared with a year ago, propelled by lower mortgage rates and higher household income. The affordability gains from house-buying power, however, were offset by the third component of the RHPI, nominal house price appreciation, which reached a record 18 percent in May, surpassing the previous peak from 2005. As always, real estate is local and national affordability trends are not necessarily reflected in local trends, as house-buying power and nominal house price gains vary greatly from city to city.
Affordability Declined in 49 of the 50 Major Markets
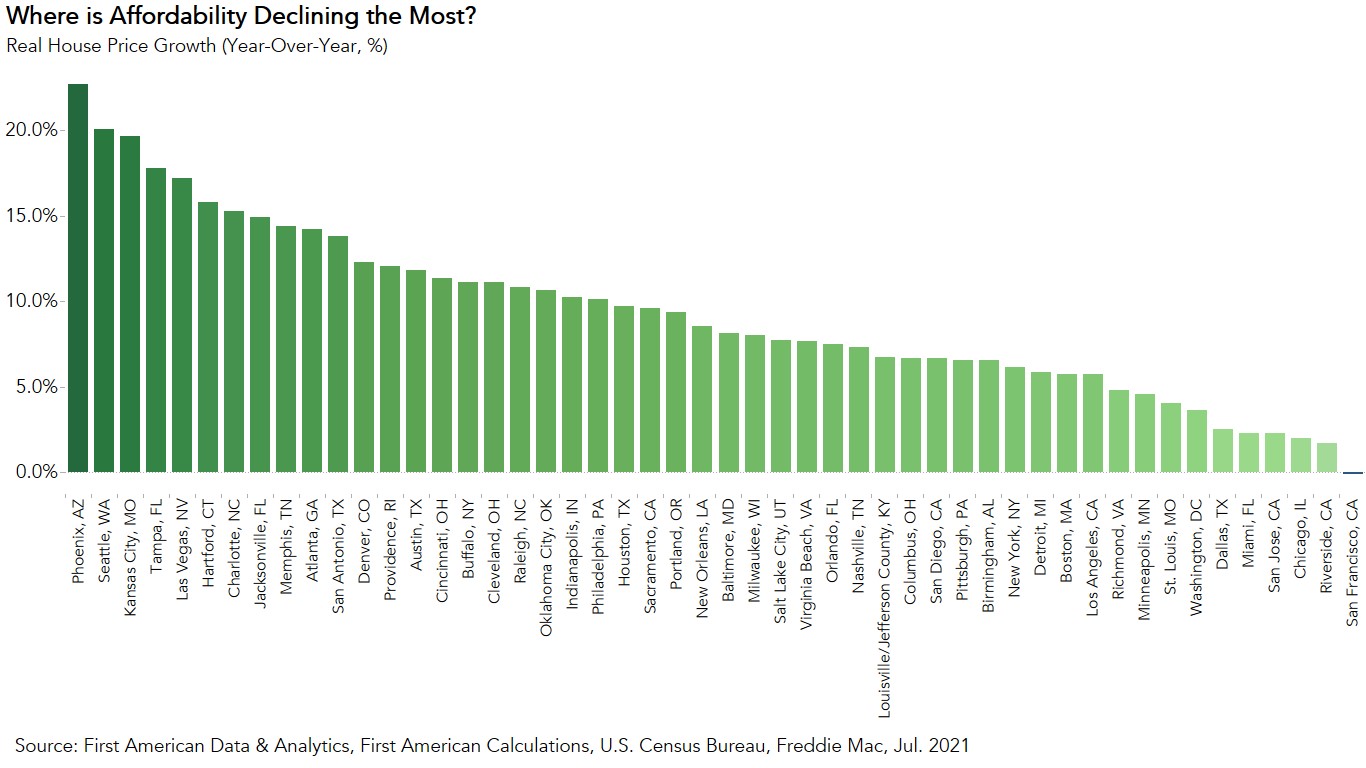
The drop in affordability was broadly felt as affordability declined year over year in 49 of the 50 markets we track. The five markets with the greatest year-over-year decline in affordability were:
1.) Phoenix (-22.7 percent)
2.) Seattle (-20.1 percent)
3.) Kansas City, Mo. (-19.6 percent)
4.) Tampa, Fla. (-17.8 percent)
5.) Las Vegas (-17.2 percent)
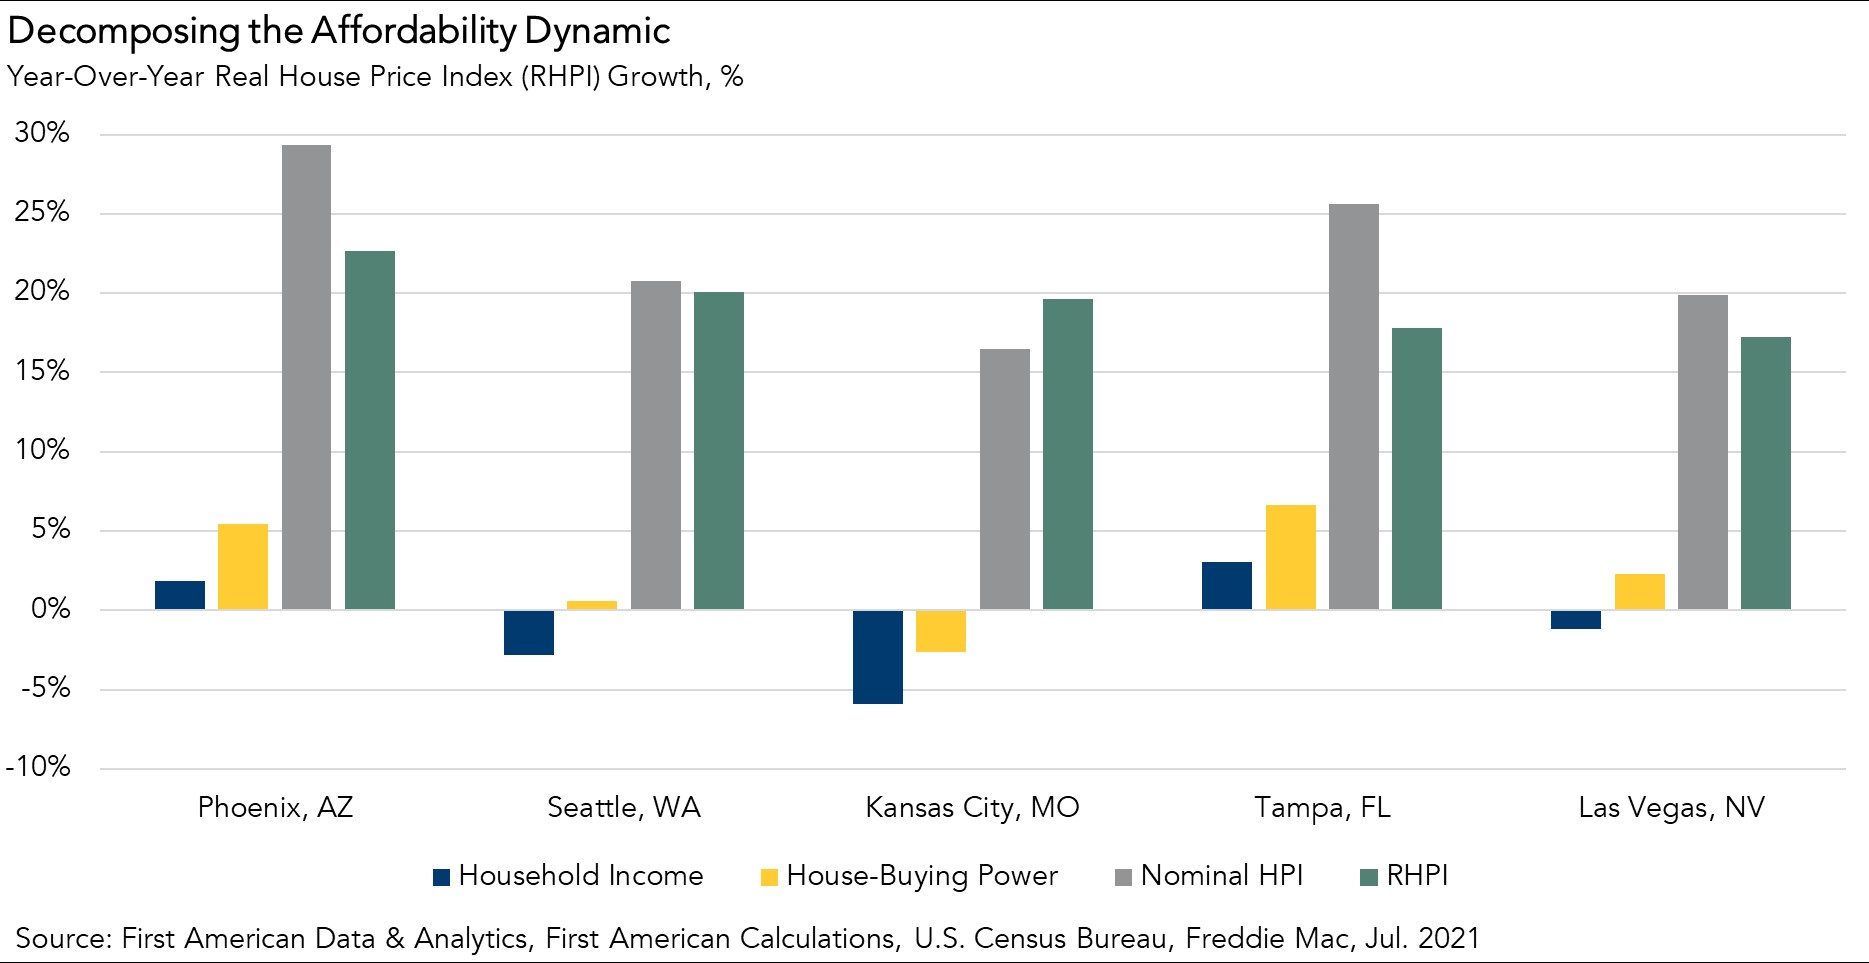
Mortgage rates are generally the same across the country, so a decline in mortgage rates boosts affordability equally in each market. Household income growth and nominal house prices, on the other hand, differ from market to market, so the affordability dynamic varies as well.
In May, Phoenix had the greatest year-over-year decrease in affordability. While annual income growth was steady at 1.9 percent, Phoenix experienced the biggest annual increase in nominal house prices of any major market – 29.3 percent. The steep increase in nominal house prices overshadowed any affordability gains from increased house-buying power. A similar dynamic played out in Tampa as year-over-year nominal house price appreciation of 25.6 percent outpaced house-buying power.
In Seattle and Las Vegas, house-buying power ticked up as the positive impact of falling mortgage rates offset a decline in household incomes. However, like Phoenix and Tampa, nominal house price growth in Seattle (20.7 percent) and Las Vegas (19.9 percent) overshadowed the house-buying power gains. Kansas City was the only one of the five markets where house-buying power declined, combining with faster house price appreciation to drive a decline in affordability.
Where Are Nominal House Prices Headed?
Declining affordability may cause potential home buyers on the margin to be priced out, prompting fewer or less intense bidding wars and causing house price appreciation to moderate. The increase in housing inventory may likewise ease pressure on nominal house price growth, though the increase remains small relative to historic levels and the broader housing supply shortage is likely to take years to reverse. Affordability trends in the coming months will depend on the supply and demand dynamics behind nominal house price appreciation – dynamics which will play out differently in each market.
For more analysis of affordability, please visit the Real House Price Index. The RHPI is updated monthly with new data. Look for the next edition of the RHPI the week of August 30, 2021.
Sources:
May 2021 Real House Price Index Highlights
The First American Real House Price Index (RHPI) showed that in May 2021:
- Real house prices increased 0.7 percent between April 2021 and May 2021.
- Real house prices increased 8.9 percent between May 2020 and May 2021.
- Consumer house-buying power, how much one can buy based on changes in income and interest rates, increased 1.4 percent between April 2021 and May 2021, and increased 8.4 percent year over year.
- Median household income has increased 4.7 percent since May 2020 and 78.0 percent since January 2000.
- Real house prices are 19.9 percent less expensive than in January 2000.
- While unadjusted house prices are now 30.1 percent above the housing boom peak in 2006, real, house-buying power-adjusted house prices remain 43.8 percent below their 2006 housing boom peak.
May 2021 Real House Price State Highlights
- The five states with the greatest year-over-year increase in the RHPI are: Arizona (+19.4 percent), Vermont (+17.0 percent), Washington (+16.6 percent), Nevada (+16.3 percent), and Connecticut (+15.4 percent).
- There were no states with a year-over-year decrease in the RHPI.
May 2021 Real House Price Local Market Highlights
- Among the Core Based Statistical Areas (CBSAs) tracked by First American, the five markets with the greatest year-over-year increase in the RHPI are: Phoenix (+22.7 percent), Seattle (+20.1 percent), Kansas City, Mo. (+19.6 percent), Tampa, Fla. (+17.8 percent), and Las Vegas (+17.2 percent).
- Among the Core Based Statistical Areas (CBSAs) tracked by First American, the only market with a year-over-year decrease in the RHPI is San Francisco (-0.1 percent).
Next Release
The next release of the First American Real House Price Index will take place the week of August 30, 2021.
About the First American Real House Price Index
The traditional perspective on house prices is fixated on the actual prices and the changes in those prices, which overlooks what matters to potential buyers - their purchasing power, or how much they can afford to buy. First American’s proprietary Real House Price Index (RHPI) adjusts prices for purchasing power by considering how income levels and interest rates influence the amount one can borrow.
The RHPI uses a weighted repeat-sales house price index that measures the price movements of single-family residential properties by time and across geographies, adjusted for the influence of income and interest rate changes on consumer house-buying power. The index is set to equal 100 in January 2000. Changing incomes and interest rates either increase or decrease consumer house-buying power. When incomes rise and mortgage rates fall, consumer house-buying power increases, acting as a deflator of increases in the house price level. For example, if the house price index increases by three percent, but the combination of rising incomes and falling mortgage rates increase consumer buying power over the same period by two percent, then the Real House Price index only increases by 1 percent. The Real House Price Index reflects changes in house prices, but also accounts for changes in consumer house-buying power.
Disclaimer
Opinions, estimates, forecasts and other views contained in this page are those of First American’s Chief Economist, do not necessarily represent the views of First American or its management, should not be construed as indicating First American’s business prospects or expected results, and are subject to change without notice. Although the First American Economics team attempts to provide reliable, useful information, it does not guarantee that the information is accurate, current or suitable for any particular purpose. © 2021 by First American. Information from this page may be used with proper attribution.


