The many twists and turns of the housing market over the last few years have made it difficult to contextualize current housing market conditions, especially as recency bias anchors us to the housing market of 2020 and 2021, which was anything but normal. Mortgage rates hit historic lows during these years yet have since increased to the highest level in two decades. Annual house price appreciation skyrocketed into the double digits in 2021, before falling and turning negative in April. To place the current housing market in context, it can be helpful to zoom out and compare today to the housing market of the 1990s, a time often dubbed as the last time the housing market was deemed not too hot, not too cold, but just right. In the two decades since, a housing bubble formed and burst, the economy entered a long, drawn-out recovery, and low interest rates became the norm. Based on a handful of indicators, today’s housing market looks a lot like the “just right” housing market of the ‘90s.
“Based on a handful of indicators, today’s housing market looks a lot like the 'just right' housing market of the ‘90s.”
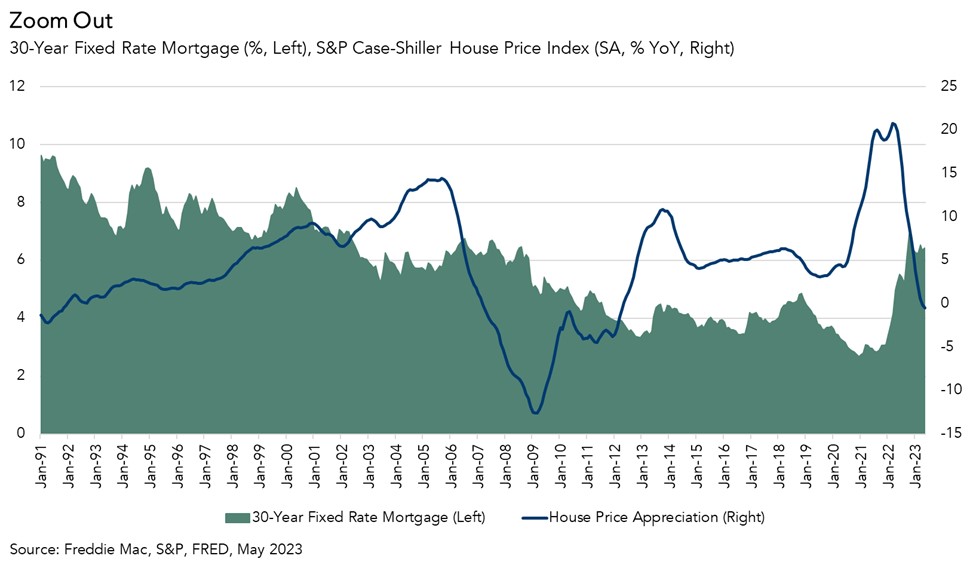
Is It a ‘90s Comeback?
How does today’s housing market compare with the housing market of the 1990s? A good place to start is with mortgage rates. While mortgage rates have steadily declined since the early 1980s, that long-run decline ended in 2022. Mortgage rates in 2023 have ranged between 6 and 7 percent. Compare this to the ‘90s housing market, when the average 30-year, fixed mortgage rate typically ranged between 7 and 9 percent and tended to be more volatile, experiencing a series of spikes throughout the decade.
House price appreciation has been on a roller coaster, but consensus forecasts indicate that we will end the year at an annual pace of growth of about 2 percent, which is much closer to the historical average of 3.8 percent. The red-hot pace of house price appreciation during the pandemic is a historical outlier. During the 1990s, home prices averaged 2.5 percent throughout the decade.
The level of home sales, new and existing, adjusted for the size of the market, is similar to the level of overall home sales during the early ‘90s. There was an average of 44,700 total home sales for every 1,000 households during the ‘90s, compared with 39,000 for every 1,000 households in May 2023. Throughout the ‘90s, a cohort of older Gen Xers and younger Baby Boomers were entering the prime home-buying years of their late 20s and early 30s. Between 1990 and 2000, 17 million households from both generations became homeowners. Today, the largest living generation, the millennials, is entering a similar stage of life.
The Fundamental Difference in Today’s Housing Market: Inventory
While demand dynamics, rates, demographics and to some extent price appreciation look a lot like the ‘90s, there is one key difference – supply. Unlike the ‘90s, the housing market today suffers from a shortage of inventory decades in the making, putting a floor on how low prices can go and creating a prisoner’s dilemma for existing homeowners. The housing market of the ‘90s, on the other hand, is mostly considered to have been balanced. Total months’ supply averaged 6.7 months in the ‘90s, in line with the rule of thumb that six months’ supply indicates a healthy market. Months’ supply in today’s market is just below four months.
The current supply shortage is exacerbated by the rate lock-in effect. While mortgage rates in the 90s jumped around, they were still lower on average than in the ‘80s. However, most existing homeowners today have mortgages with historically low rates that are not expected to return in the foreseeable future. As a result, there is a financial disincentive for homeowners who are locked into low mortgage rates to sell their home and buy a new home at a higher rate, leading to lower housing market turnover and limiting more supply from reaching the market.
This New “Normal” Will Likely Look Different
Zooming out over a longer time horizon can help make sense of the upheaval in the housing market today and understand where we are compared with the historical “normal.” Mortgage rates, home sales, and house prices today are not unusual compared with previous periods like the ‘90s. At the same time, averages obscure the differences in fundamentals that drive housing in different periods. The housing market faces a unique set of challenges today, including a deep supply shortage and an unusually severe rate lock-in effect, which may create a new normal for the housing market unlike that of the ‘90s or any other decade.


