The average 30-year, fixed mortgage rate trended upward throughout September, approaching 8 percent in early October. Higher mortgage rates have a dual impact on the housing market – reducing affordability for buyers and strengthening the rate lock-in effect for potential sellers. The combination of reduced affordability and an even stronger rate lock-in effect is likely to continue to suppress home sales because you can’t buy what’s not for sale, even if you can afford it.
"Today’s housing market isn’t anything like the housing market of the mid-2000s – the housing market today is not overbuilt, nor is it driven by loose lending standards, sub-prime mortgages, or homeowners who are highly leveraged. However, the current housing market is similar to the market of the 1980s. History doesn’t repeat itself, but it often rhymes."
Existing-home sales in August were just above a 4 million seasonally adjusted annualized rate (SAAR), but leading indicators, such as purchase mortgage applications, signal that sales may dip below 4 million for the first time since the depths of the Great Financial Crisis, between July and October 2010. But the housing market today is very different from the housing market during the aftermath of the previous housing boom. Today’s housing market isn’t anything like the housing market of the mid-2000s – the housing market today is not overbuilt, nor is it driven by loose lending standards, sub-prime mortgages, or homeowners who are highly leveraged. However, the current housing market is similar to the market of the 1980s. History doesn’t repeat itself, but it often rhymes.
Demographics, Inflation, and Rates “Rhyme” with the 1980s
In the late 1970s and early 1980s, baby boomers were aging into their prime home-buying years, providing a wave of demographic demand. Since millennials are “an echo” of the baby boomers and are currently aging into their prime home-buying years, the demographic picture in the early ‘80s mirrors today’s housing market.
The housing market today also faces a recession very similar to that of the late ‘70s and early ‘80s, according to our Housing Recession indicator. In the late ‘70s and early ‘80s, interest rates soared as the Federal Reserve fought to rein in the “Great Inflation.” Sound familiar? As a result of tighter monetary policy and higher inflation, mortgage rates increased to a peak of 18 percent in 1981. As mortgage rates reached levels unseen before or since, homes became significantly less affordable and home sales fell. By October 1982, inflation had fallen to 5 percent. The Fed allowed the federal funds rate to fall back down to approximately 9 percent by the end of 1982 and the 30-year, fixed mortgage rate fell alongside lower inflation and a lower federal funds rate.
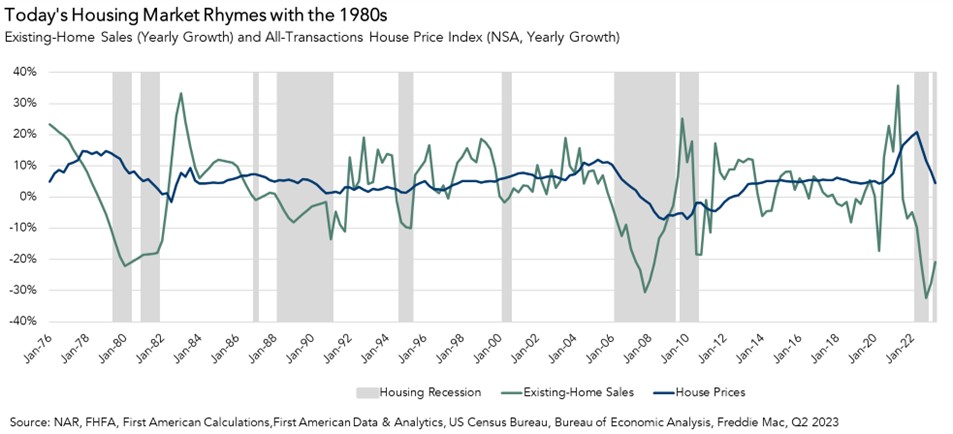
Existing-home sales fell nearly 50 percent from the peak in 1978 to the trough in 1982, before rebounding alongside lower mortgage rates. Home prices surged by over 14 percent in 1978, then flatlined as year-over-year growth slowed to just 1 percent by 1982. Today’s market is similar – home sales face more downward pressure than prices. Home prices climbed nearly 17 percent on an annual basis in 2022, before slowing to a 5 percent yearly growth rate in the second quarter of this year. Meanwhile, existing-home sales plunged by nearly 40 percent from the recent peak in January of 2022 to the latest August figure. Demographic demand against a severely limited supply of homes for sale continues to put a floor on how low prices can go, but sales suffer as potential buyers are priced out and existing homeowners see no incentive to sell.
Where Does the Housing Market Go from Here?
The housing market did rebound from the 1980s, but it took some time. Inflation and mortgage rate stabilization were key. Because mortgage rates have increased further in October, we expect the housing recessionary conditions to linger in the near-term. However, industry forecasts predict that mortgage rates will moderate if the Federal Reserve stops further monetary tightening and provides investors with more certainty. Mortgage rate stability, even if the stabilization occurs with rates at a higher level, is the key to an eventual housing recovery.
September 2023 Potential Home Sales
For the month of September, First American Data & Analytics updated its proprietary Potential Home Sales Model to show that:
- Potential existing-home sales decreased to a 5.37 million seasonally adjusted annualized rate (SAAR), a 0.03 percent month-over-month decrease.
- This represents a 53.9 percent increase from the market potential low point reached in February 1993.
- The market potential for existing-home sales increased 0.3 percent compared with a year ago, a gain of 14,700 (SAAR) sales.
- Currently, potential existing-home sales is 1,424,000 (SAAR), or 21.0 percent, below the peak of market potential, which occurred in April 2006.
First American Deputy Chief Economist Odeta Kushi contributed to this post.
What Insight Does the First American Data & Analytics Potential Home Sales Model Reveal?
When considering the right time to buy or sell a home, an important factor in the decision should be the market’s overall health, which is largely a function of supply and demand. Knowing how close the market is to a healthy level of activity can help consumers determine if it is a good time to buy or sell, and what might happen to the market in the future. That is difficult to assess when looking at the number of homes sold at a particular point in time without understanding the health of the market at that time. Historical context is critically important. Our potential home sales model measures what a healthy market for home sales should be based on the economic, demographic and housing market environments.
About the First American Data & Analytics Potential Home Sales Model
Potential home sales measures existing-home sales, which include single-family homes, townhomes, condominiums and co-ops on a seasonally adjusted annualized rate based on the historical relationship between existing-home sales and U.S. population demographic data, homeowner tenure, house-buying power in the U.S. economy, price trends in the U.S. housing market, and conditions in the financial market. When the actual level of existing-home sales are significantly above potential home sales, the pace of turnover is not supported by market fundamentals and there is an increased likelihood of a market correction. Conversely, seasonally adjusted, annualized rates of actual existing-home sales below the level of potential existing-home sales indicate market turnover is underperforming the rate fundamentally supported by the current conditions. Actual seasonally adjusted annualized existing-home sales may exceed or fall short of the potential rate of sales for a variety of reasons, including non-traditional market conditions, policy constraints and market participant behavior. Recent potential home sale estimates are subject to revision to reflect the most up-to-date information available on the economy, housing market and financial conditions. The Potential Home Sales model is published prior to the National Association of Realtors’ Existing-Home Sales report each month.


