First American’s proprietary Potential Home Sales model looks at April 2017 data and includes analysis from First American Chief Economist Mark Fleming on how the real estate market is performing versus its potential.
April 2017 Potential Home Sales
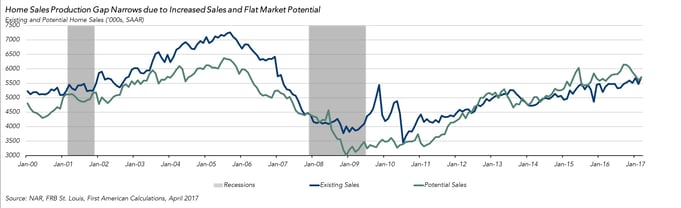
For the month of April, First American updated its proprietary Potential Home Sales model to show that:
- Potential existing-home sales decreased to a 5.69 million seasonally adjusted, annualized rate (SAAR), a 0.2 percent decline over last month’s revised data.
- This represents an 89.3 percent increase from the market potential low point reached in December 2008.
- In April, the market potential for existing-home sales fell by 0.1 percent compared with a year ago, a decline of 5,000 (SAAR) sales.
- Currently, potential existing-home sales is 674,000 (SAAR), or 11.8 percent below the pre-recession peak of market potential, which occurred in July 2005.
Market Performance Gap
- The market for existing-home sales is underperforming its potential by 0.6 percent or an estimated 32,000 (SAAR) sales.
- Market underperformance has improved 84.1 percent compared to this time last year. In April 2017, the housing market for existing-home sales was underperforming its potential by 200,000 (SAAR) sales.
"The market faces a 'prisoner’s dilemma.' If everyone sells, there will be plenty of supply, but the risk of selling when others don’t, the inability to find a home to purchase at the right price, is preventing homeowners from putting their homes on the market."
The Housing Market Faces a “Prisoner’s Dilemma”
“Demand for existing-homes remains strong, as positive economic conditions and the demographic tail wind of Millennial demand continues to grow. Meanwhile, sellers are increasingly unwilling to list their homes for sale. The market faces a ‘prisoner’s dilemma.’ If everyone sells, there will be plenty of supply, but the risk of selling when others don’t, the inability to find a home to purchase at the right price, is preventing homeowners from putting their homes on the market,” said Mark Fleming, chief economist at First American. “The ‘prisoner’s dilemma’ in housing is restricting supply, causing increased house price appreciation and falling affordability.”
Chief Economist Analysis Highlights
- Conflicting market forces kept the potential for existing-home sales essentially unchanged in April, falling 0.1 percent compared to a year ago.
- Strong consumer demand fueled gains in market potential for existing-home sales, but the gains were offset by the deterioration in affordability driven by widespread tight supply conditions.
- According to the most recent report from the National Association of Realtors (NAR), actual existing-home sales surged to the highest rate seen since 2007, 5.71 million sales, indicating that demand remains strong, even as affordability falls.
- Healthy wage growth, which increased 2.5 percent over the past 12 months, and unemployment at its lowest level since May 2007, are both contributing to strong demand.
- According to the First American Real House Price Index, the fast pace of house price growth, combined with interest rates 40 basis points higher than a year ago, has had a material impact on affordability, which fell 11.0 percent compared with February 2016.
- Analysis of Realtor.com data reveals that the average number of days on market for homes sold in April was 73 days, down five days compared to a year ago, and 35 days less than the buyer’s market of 2012. As the seller’s market continues to strengthen, affordability is expected to decline further. Yet, it’s unclear if the declining affordability will begin to curtail demand.
What Insight Does the Potential Home Sales Model Reveal?
When considering the right time to buy or sell a home, an important factor in the decision should be the market’s overall health, which is largely a function of supply and demand. Knowing how close the market is to a healthy level of activity can help consumers determine if it is a good time to buy or sell, and what might happen to the market in the future. That’s difficult to assess when looking at the number of homes sold at a particular point in time without understanding the health of the market at that time. Historical context is critically important. Our potential home sales model measures what we believe a healthy market level of home sales should be based on the economic, demographic, and housing market environments.
About the Potential Home Sales Model
Potential home sales measures existing-homes sales, which include single-family homes, townhomes, condominiums and co-ops on a seasonally adjusted annualized rate based on the historical relationship between existing-home sales and U.S. population demographic data, income and labor market conditions in the U.S. economy, price trends in the U.S. housing market, and conditions in the financial market. When the actual level of existing-home sales are significantly above potential home sales the pace of turnover is not supported by market fundamentals and there is an increased likelihood of a market correction. Conversely, seasonally adjusted, annualized rates of actual existing-home sales below the level of potential existing-home sales indicate market turnover is underperforming the rate fundamentally supported by the current conditions. Actual seasonally adjusted, annualized existing-home sales may exceed or fall short of the potential rate of sales for a variety of reasons, including non-traditional market conditions, policy constraints and market participant behavior. Recent potential home sale estimates are subject to revision in order to reflect the most up-to-date information available on the economy, housing market and financial conditions. The Potential Home Sales model is published prior to the National Association of Realtors’ Existing-Home Sales report each month.


