First American’s proprietary Potential Home Sales model examines September 2017 data and includes analysis from First American Chief Economist Mark Fleming on how the real estate market is performing versus its potential.
"Existing homeowners reluctant to sell and hurricane-related disruption are dampening existing-home sales."
September 2017 Potential Home Sales
For the month of September, First American updated its proprietary Potential Home Sales model to show that:
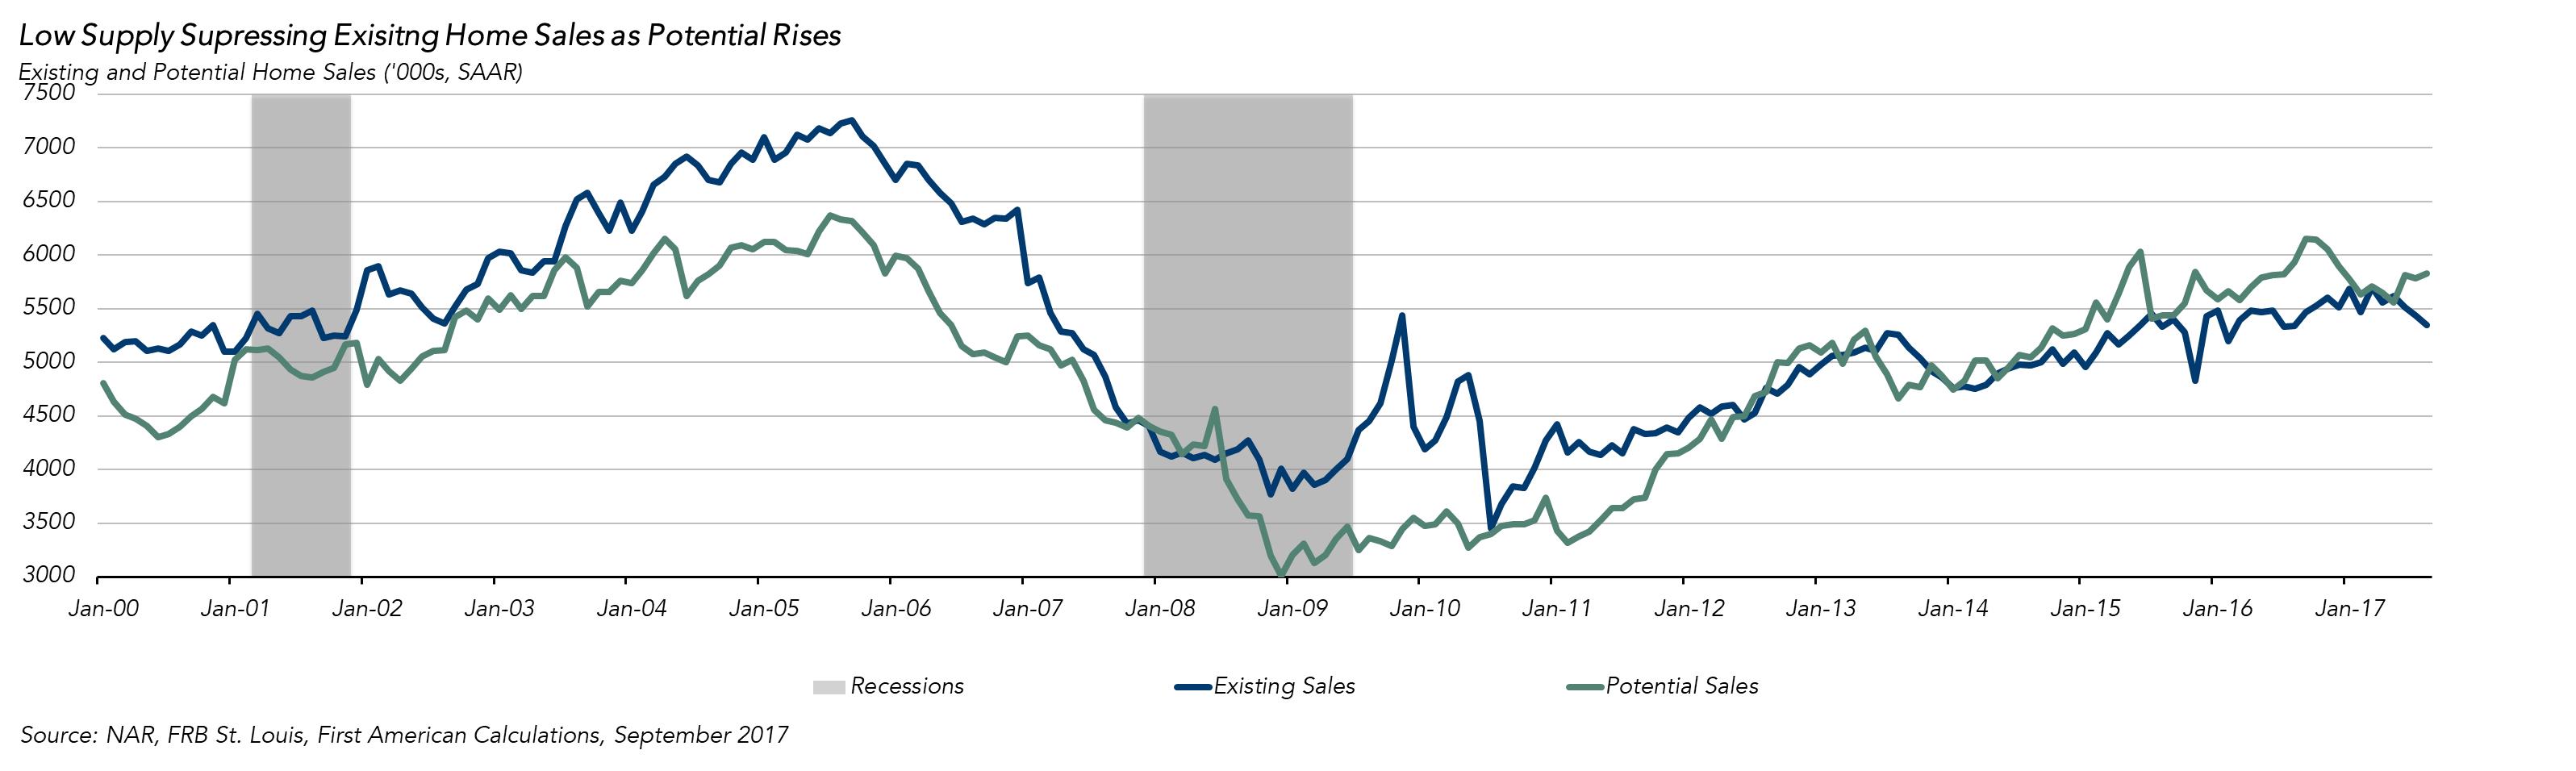
- Potential existing-home sales increased to a 5.84 million seasonally adjusted, annualized rate (SAAR), a 0.3 percent month-over-month increase.
- This represents a 94.4 percent increase from the market potential low point reached in December 2008.
- In September, the market potential for existing-home sales decreased by 5.0 percent compared with a year ago, a loss of 307,000 (SAAR) sales.
- Currently, potential existing-home sales is 521,000 (SAAR), or 8.9 percent, below the pre-recession peak of market potential, which occurred in July 2005.
Market Performance Gap
- The market for existing-home sales is underperforming its potential by 7.8 percent or an estimated 453,000, (SAAR) sales.
- Market potential increased by an estimated 16,000 (SAAR) sales between August 2017 and September 2017.
Hurricanes and Tight Inventory Mean Lower Sales in the Short Run
“Existing home sales as reported by the National Association of Realtors remain below potential due to supply constraints caused by existing homeowners' reluctance to list their homes for sale for fear of not being able to find a home to buy. Additionally, Hurricanes Irma and Harvey may negatively impact actual existing-home sales regionally, but only temporarily. Based on data from previous natural disasters, home buying usually rebounds as households recover from the disruption of natural disasters.”
Chief Economist Analysis Highlights
- The housing markets’ potential for existing-home sales increased moderately, between August 2017 and September 2017, as mortgage rates remained below 4 percent.
- The year-over-year decline in the number of existing-home sales, a function of tight supply, resulted in a wider market performance gap in September 2017 compared to August 2017. The number of homes for sale has declined year-over-year for the past 28 months, and has fallen 6.4 percent over the past 12 months, according to the National Association of Realtors (NAR).
- Since 2009, based on our analysis of Census Bureau and Department of Housing and Urban Development (HUD) data, the number of new households has increased by 5.9 million, while the net new number of housing units (single and multifamily) has only increased by 3.5 million, meaning there is a shortage of 2.4 million housing units in the United States.
- The lack of inventory relative to demand, combined with limited new supply is driving the fast pace of price appreciation. When combined with decreasing consumer home purchasing power as mortgage rates increase, affordability is declining.
- According to the First American Real House Price Index, affordability is down 10.4 percent in July compared to a year ago, but housing remains affordable by historic measures.
What Insight Does the Potential Home Sales Model Reveal?
When considering the right time to buy or sell a home, an important factor in the decision should be the market’s overall health, which is largely a function of supply and demand. Knowing how close the market is to a healthy level of activity can help consumers determine if it is a good time to buy or sell, and what might happen to the market in the future. That’s difficult to assess when looking at the number of homes sold at a particular point in time without understanding the health of the market at that time. Historical context is critically important. Our potential home sales model measures what we believe a healthy market level of home sales should be based on the economic, demographic, and housing market environments.
About the Potential Home Sales Model
Potential home sales measures existing-homes sales, which include single-family homes, townhomes, condominiums and co-ops on a seasonally adjusted annualized rate based on the historical relationship between existing-home sales and U.S. population demographic data, income and labor market conditions in the U.S. economy, price trends in the U.S. housing market, and conditions in the financial market. When the actual level of existing-home sales are significantly above potential home sales the pace of turnover is not supported by market fundamentals and there is an increased likelihood of a market correction. Conversely, seasonally adjusted, annualized rates of actual existing-home sales below the level of potential existing-home sales indicate market turnover is underperforming the rate fundamentally supported by the current conditions. Actual seasonally adjusted, annualized existing-home sales may exceed or fall short of the potential rate of sales for a variety of reasons, including non-traditional market conditions, policy constraints and market participant behavior. Recent potential home sale estimates are subject to revision in order to reflect the most up-to-date information available on the economy, housing market and financial conditions. The Potential Home Sales model is published prior to the National Association of Realtors’ Existing-Home Sales report each month.

