A common narrative over the last several years is that Millennials are breaking with the habits of their parents when it comes to home buying. Millennials rent longer, live with their parents, and are burdened with student loan debt. In short, it would seem that for a variety of reasons they aren’t as interested in homeownership as their predecessors. We’ve examined this issue in previous posts, and found that, contrary to conventional wisdom, Millennials continue to strive for homeownership. Advancing their education has been a top priority for Millennials, and they stand to benefit from the higher incomes that accompany higher education levels. As the first wave of Millennials ages into homeownership, the real question becomes, how healthy is the housing market they are entering?
The challenge with measuring the health of the housing market is that there is no single measure. Prices, transaction volumes and distress are all commonly reported housing statistics that can be indicative of overall market health. Our “Housing Health” spider graph below incorporates a variety of housing statistics and data to show how today’s housing market fares in comparison to its peak in 2006 and its trough in 2012, based on house prices, across multiple measures. View the Housing Health spider graph clockwise from the top for an illustration of how these three points in time (today, 2006 and 2012) compare when looking at overall homeownership, house prices (real and nominal), home sale transaction volumes (potential, existing, and new), and finally, home-buying distress measures indicated by foreclosure counts and REO sales.
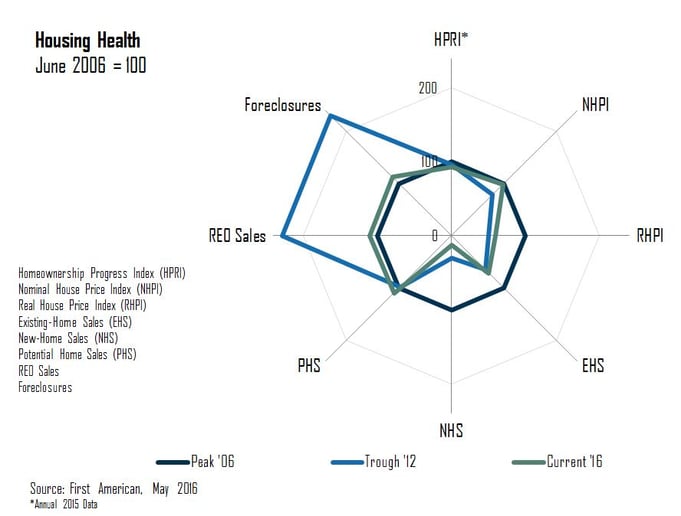
Our Homeownership Progress Index measures homeownership levels compared to the peak and trough. Homeownership rates haven’t exhibited extreme volatility, however, in 2015 the index score was 93, which is 7 percent below peak 2006 levels. This is likely due to baby boomers aging out of homeownership and the imminent rise of Millennials as a home buying force. The first of the Millennials are just entering their prime home buying age, which is not yet reflected in the overall homeownership rate. Because the Homeownership Progress Index does not paint a full picture, other indicators are used to convey housing health.
House prices are important in assessing housing market health, as housing affordability is a key determinant of how many consumers will be able buy. In the Housing Health spider graph, nominal house prices (NHPI) are currently the same as they were at the peak of the market in 2006. However, the First American Real House Price Index (RHPI) reveals that homes are much more affordable than many believe. The RHPI measures the price changes of single-family properties adjusted for the impact of income and interest rates. Historically low mortgage rates have contributed to surging house-buying power and increasing affordability for consumers. So, worry not, Millennials, stronger incomes and lower rates are making it easier for you to buy.
But prices aren’t the only indicator of a healthy housing market – existing-home sales are indicative of aggregate demand among consumers. Existing-home sales typically grow with rising prices and economic expansion and fall during recession. New- and existing-home sales are both below their peak levels today, and new-home sales remain below their low point set during the height of the housing crisis. The gap between existing-home sales and new-home sales is often called the “distressed gap.” Post-crisis, the gap existed mostly because the flood of distressed sales kept the number of existing home sales elevated, but new home sales depressed. Home-buyers need not be as concerned with this gap, as it’s expected to narrow as new-home sales increase.
“To those who call the Millennials the “renter generation,” I say the American Dream of owning a home is as attainable now as it ever has been...”
Potential Home Sales (PHS), which are currently above 2006 levels, measures what we believe a healthy market level of home sales should be based on the economic, demographic, and housing market environment. For example, at the height of the housing boom in 2006 existing-home sales were approximately 7 million a year, compared with about 3.5 million in 2011 after the first-time homebuyer tax credit expired. Today’s current market potential exceeds the market potential at the peak of the housing market in 2006 because low mortgage rates, improvements in the labor market and rising wages are creating historically favorable conditions for consumer house-buying power. Millennials on the verge of buying your first home take note, the market is healthy based on its fundamentals.
Last, to complete the picture, foreclosures and REO sales – both measures of distress – are much lower than they were at the height of the housing crisis in the 2012 economic trough, and getting close to the very low levels observed at the time of the housing peak. Distress measures approaching the low levels observed at the housing market peak indicates a healthy housing market.
As the first of the Millennials age into homeownership, they are welcomed by a healthy housing market. Not all indicators have rebounded to their all-time healthiest, but they are on their way.
If the housing market were a hospital patient, it was in the emergency room and on life support in 2012, in recovery since then, and is now at home and almost fully healed. Most importantly, affordability is at quarter-century highs. To those who call the Millennials the “renter generation,” I say the American Dream of owning a home is as attainable now as it ever has been.
Odeta Kushi contributed to this blog post.


