The coronavirus pandemic continued its historic assault on the domestic and global economy in April, and the housing market did not go unscathed. Typically, the hot spring home-buying season would be in full swing in April, but pandemic-related impacts, including shelter-in-place orders, the rapid surge in unemployment, and declining consumer confidence chilled a promising spring for the housing market.
Our Potential Home Sales Model reflects the significant impact of the pandemic on the market potential for existing-home sales, which fell to the lowest level since August 2012. Housing market potential decreased 5.1 percent in April relative to the previous month, and fell 12.6 percent year-over-year, a decline of 672,230 (SAAR) potential existing-home sales. Credit tightening remained the largest drag on housing market potential for the second month in a row. However, rising tenure length is a growing headwind for housing market potential as well, as potential sellers keep their homes off the market during this period of uncertainty.
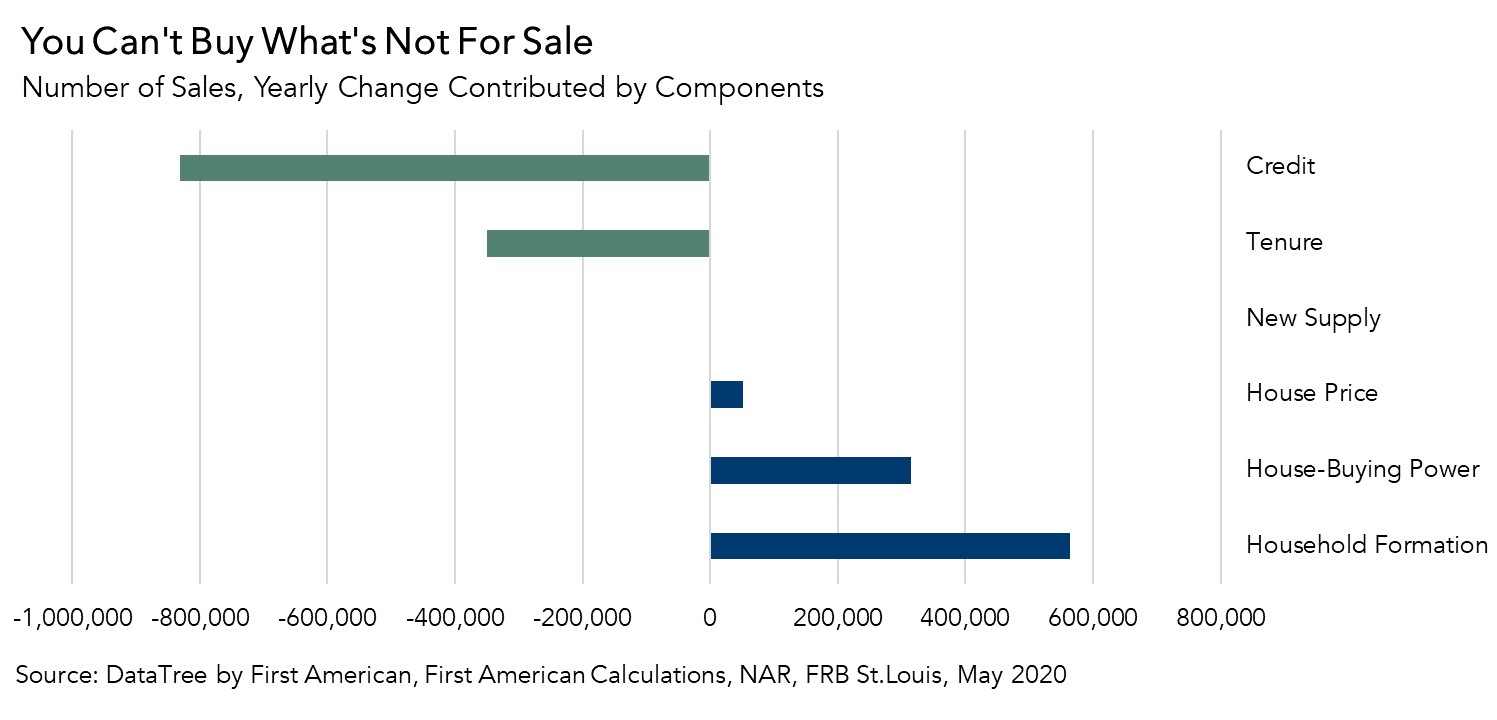
“As more homeowners are reluctant to list their homes for sale amid the pandemic, the supply of homes available to potential home buyers continues to dwindle. You can’t buy what’s not for sale.”
Pandemic Strengthens Supply Squeeze
Similar to the previous month, tightening credit had the largest year-over-year negative impact (831,310 potential home sales) on potential home sales. Lenders tightened their lending criteria to account for the greater likelihood of forbearance and delinquency. However, rising tenure length also had a strong impact, reducing the potential for existing-home sales by nearly 350,000 sales. Tenure length, the average length of time someone lives in their home, reached record levels in April, just exceeding 12 years, according to DataTree by First American. As increasingly fewer people list their homes for sale, housing supply tightens, reducing housing market potential.
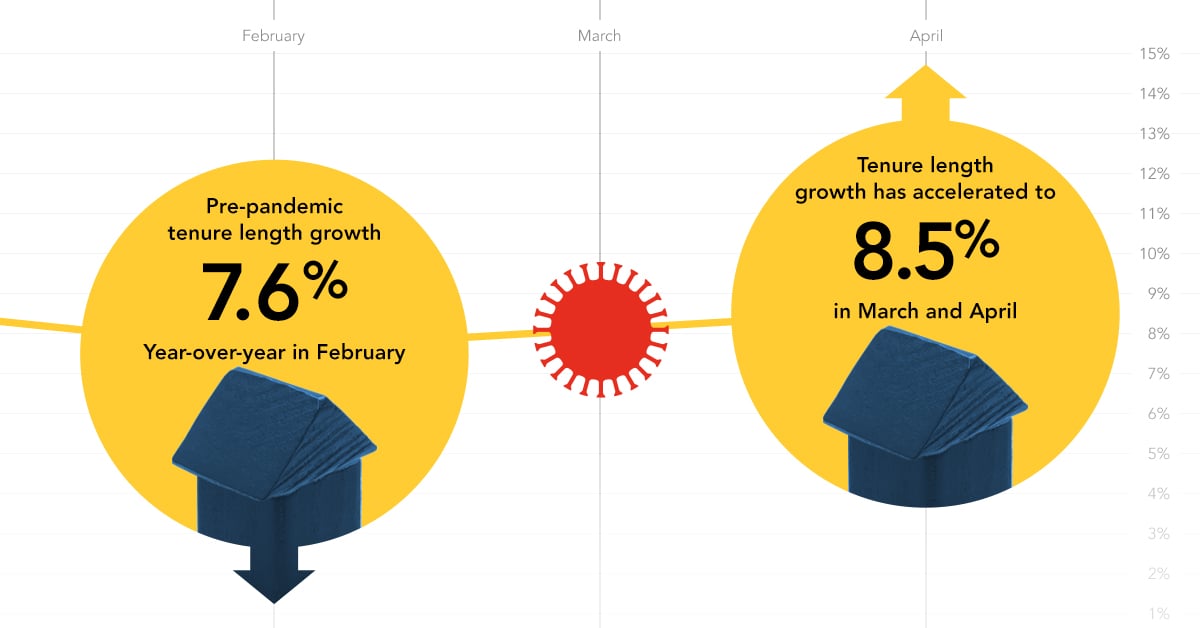
The pandemic has strengthened the long-run trend in tenure length, which has been increasing since the aftermath of the housing market crash. In the months preceding the pandemic, the pace of tenure length growth had slowed, falling to 7.6 percent year-over-year in February, but has since accelerated to 8.5 percent in March and April. The main reason? Existing homeowners are hesitant to list their homes for sale in uncertain economic times, and some are concerned about the potential health risks associated with showing homes to buyers. Existing-home listings fell by 44 percent compared with one year ago in April, which is typically one of the busiest months for existing-home sales. As more homeowners are reluctant to list their homes for sale amid the pandemic, the supply of homes available to potential home buyers continues to dwindle. You can’t buy what’s not for sale.
Looking Ahead, Housing Market Shows Signs of a Thaw
Despite the pandemic, showing activity has rebounded in May after reaching a trough in mid-April. Mortgage applications for home purchases have also rebounded, increasing for four consecutive weeks, and are now only down 10 percent relative to one year ago. Last month at this time, they were down 35 percent relative to the same week one year ago. Historically low mortgage rates, as well as new technology that allows buyers to house-hunt from afar, seems to have lifted the housing market from April’s low point. Strict credit standards and rising tenure length will continue to be headwinds to the potential for existing-home sales, but the housing market is showing early signs of resilience amid the pandemic.
April 2020 Potential Home Sales
For the month of April, First American updated its proprietary Potential Home Sales Model to show that:
- Potential existing-home sales decreased to a 4.68 million seasonally adjusted annualized rate (SAAR), a 5.1 percent month-over-month decrease.
- This represents a 39.4 percent increase from the market potential low point reached in February 1993.
- The market potential for existing-home sales decreased 12.6 percent compared with a year ago, a loss of nearly 672,230 (SAAR) sales.
- Currently, potential existing-home sales is 2.05 million (SAAR), or 30.4 percent below the pre-recession peak of market potential, which occurred in March 2004.
Market Performance Gap
- The market for existing-home sales outperformed its potential by 19.6 percent or an estimated 916,160 (SAAR) sales.
- The market performance gap increased by an estimated 244,580 (SAAR) sales between March 2020 and April 2020.
First American Deputy Chief Economist Odeta Kushi contributed to this post.
What Insight Does the Potential Home Sales Model Reveal?
When considering the right time to buy or sell a home, an important factor in the decision should be the market’s overall health, which is largely a function of supply and demand. Knowing how close the market is to a healthy level of activity can help consumers determine if it is a good time to buy or sell, and what might happen to the market in the future. That is difficult to assess when looking at the number of homes sold at a particular point in time without understanding the health of the market at that time. Historical context is critically important. Our potential home sales model measures what we believe a healthy market level of home sales should be based on the economic, demographic and housing market environments.
About the Potential Home Sales Model
Potential home sales measures existing-homes sales, which include single-family homes, townhomes, condominiums and co-ops on a seasonally adjusted annualized rate based on the historical relationship between existing-home sales and U.S. population demographic data, homeowner tenure, house-buying power in the U.S. economy, price trends in the U.S. housing market, and conditions in the financial market. When the actual level of existing-home sales are significantly above potential home sales, the pace of turnover is not supported by market fundamentals and there is an increased likelihood of a market correction. Conversely, seasonally adjusted, annualized rates of actual existing-home sales below the level of potential existing-home sales indicate market turnover is underperforming the rate fundamentally supported by the current conditions. Actual seasonally adjusted annualized existing-home sales may exceed or fall short of the potential rate of sales for a variety of reasons, including non-traditional market conditions, policy constraints and market participant behavior. Recent potential home sale estimates are subject to revision to reflect the most up-to-date information available on the economy, housing market and financial conditions. The Potential Home Sales model is published prior to the National Association of Realtors’ Existing-Home Sales report each month.


