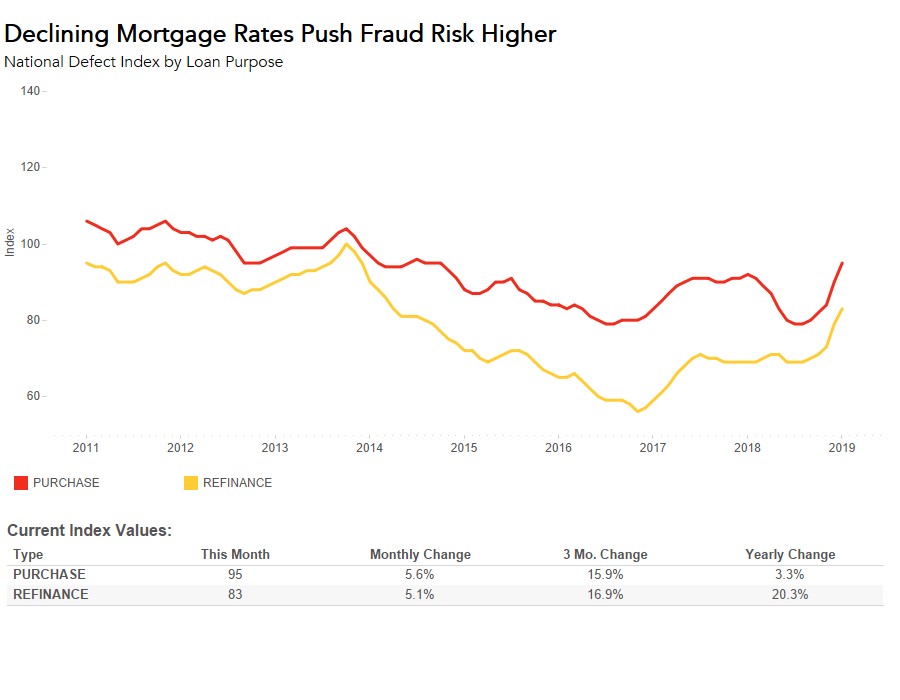
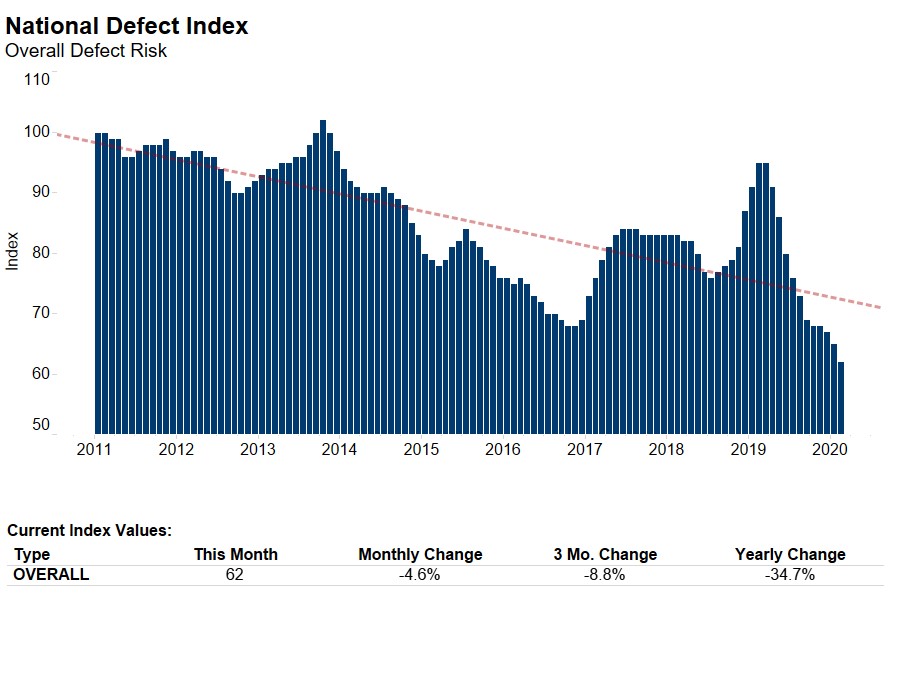
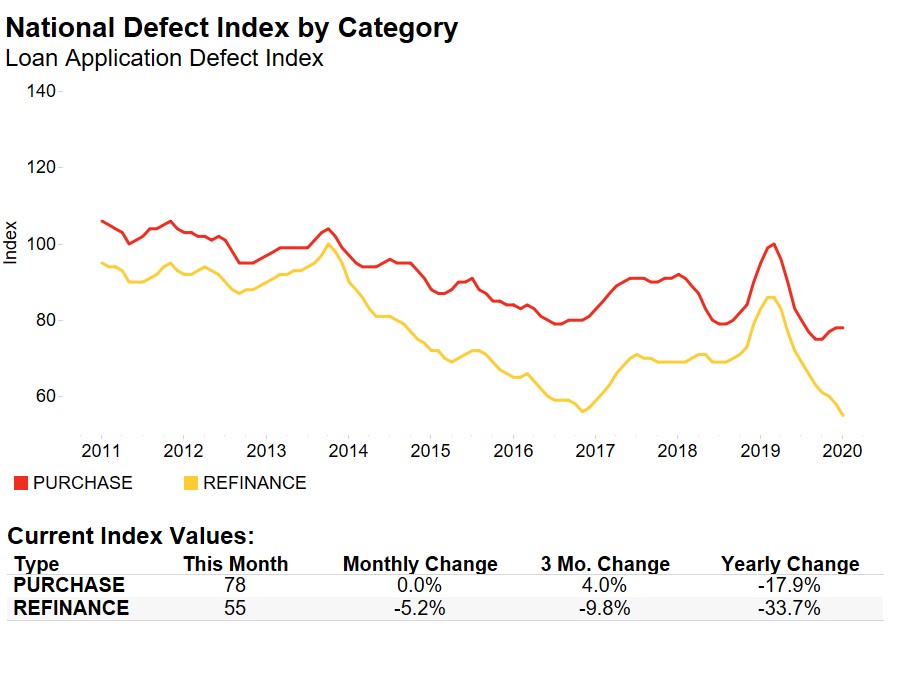
The Loan Application Defect Index for purchase transactions continued its upward trend, increasing 5.6 percent in January compared with the month before, the fifth consecutive month defect risk in purchase transactions has risen. Overall, the frequency of defects, fraudulence and misrepresentation in the information submitted in mortgage loan applications increased by 4.6 percent compared with the previous month. While overall fraud risk has been on the rise since July 2018 due partially to the impact of natural disasters, the last two months have experienced an acceleration in fraud risk—what could be driving this change?
“The overall rise in purchase and refinance applications, coupled with strong first-time home buyer demand and tight inventory, bodes well for an early spring home-buying season, but may contribute to further increases in defect risk.”
Plunge in Rates, Spike in Mortgage Applications
Surprisingly, mortgage rates declined in December and continued falling into January, reaching their lowest levels since April 2018. Prospective home buyers and existing homeowners reacted to the lower rates, resulting in a mini-boom in mortgage applications, both purchase and refinance. In fact, according to the Mortgage Bankers Association, overall mortgage application volume increased 23.5 percent for the week ending on January 4, 2019. The decline in mortgage rates spurred a flurry of refinance activity, with refinance applications surging 35 percent week-to-week to their highest level since July 2018. Similarly, mortgage purchase applications jumped 17 percent.
The Defect Index has historically illustrated a distinct difference in risk between refinance and purchase loan transactions – refinance loan transactions have always been less risky than purchase transactions. The relationship has often shown that as mortgage rates rise, so does overall defect, fraud and misrepresentation risk. As mortgage rates rise, fewer people refinance, so the share of less risky refinance loan transactions decreases and the share of more risky purchase transactions increases. This dynamic played out throughout most of 2018, as rates were rising. However, the forces driving the acceleration in fraud risk over the last two months are a little less clear because the recent decline in mortgage rates prompted a surge in both purchase and refinance mortgage applications.

Rising Demand, Competitive Market May Contribute to Increasing Fraud Risk
The overall rise in purchase and refinance applications, coupled with strong first-time home buyer demand and tight inventory, bodes well for an early spring home-buying season, but may contribute to further increases in defect risk. Historically, purchase transactions tend to be more at risk of defects, fraud and misrepresentation, and the pressures resulting from rising demand and a strong sellers’ market compounds that risk. When home values are rising and the housing market is competitive, more buyers want to enter the market. As a result, misrepresentation and fraud are more likely on a loan application.
Last week, mortgage rates fell even further to 4.35 percent, their lowest level since February 2018. As home buyers continue to take advantage of this lower rate environment amid a very competitive market, we can expect fraud risk will continue to trend higher.
The Defect Index is updated monthly with new data. Look for the next edition of the Defect Index the week of March 25, 2019.
January 2019 Loan Application Defect Index
The First American Loan Application Defect Index showed that in January 2019:
- The frequency of defects, fraudulence and misrepresentation in the information submitted in mortgage loan applications increased by 4.6 percent compared with the previous month.
- Compared to January 2018, the Defect Index increased by 9.6 percent.
- The Defect Index is down 10.8 percent from the high point of risk in October 2013.
- The Defect Index for refinance transactions increased by 5.1 percent compared with the previous month, and is up 20.3 percent compared with a year ago.
- The Defect Index for purchase transactions increased by 5.6 percent compared with the previous month, and is up 3.3 percent compared with a year ago.
January 2019 State Highlights
- The five states with the greatest year-over-year increase in defect frequency are: West Virginia (+37.5 percent), Maine (+35.8 percent), New York (+35.5 percent), Nebraska (+33.3 percent), and Alaska (+30.7 percent).
- The five states with the greatest year-over-year decrease in defect frequency are: Vermont (-12.8 percent), Florida (-5.1 percent), Arkansas (-3.7 percent), Arizona (-3.6 percent), and Ohio (-1.3 percent).
January 2019 Local Market Highlights
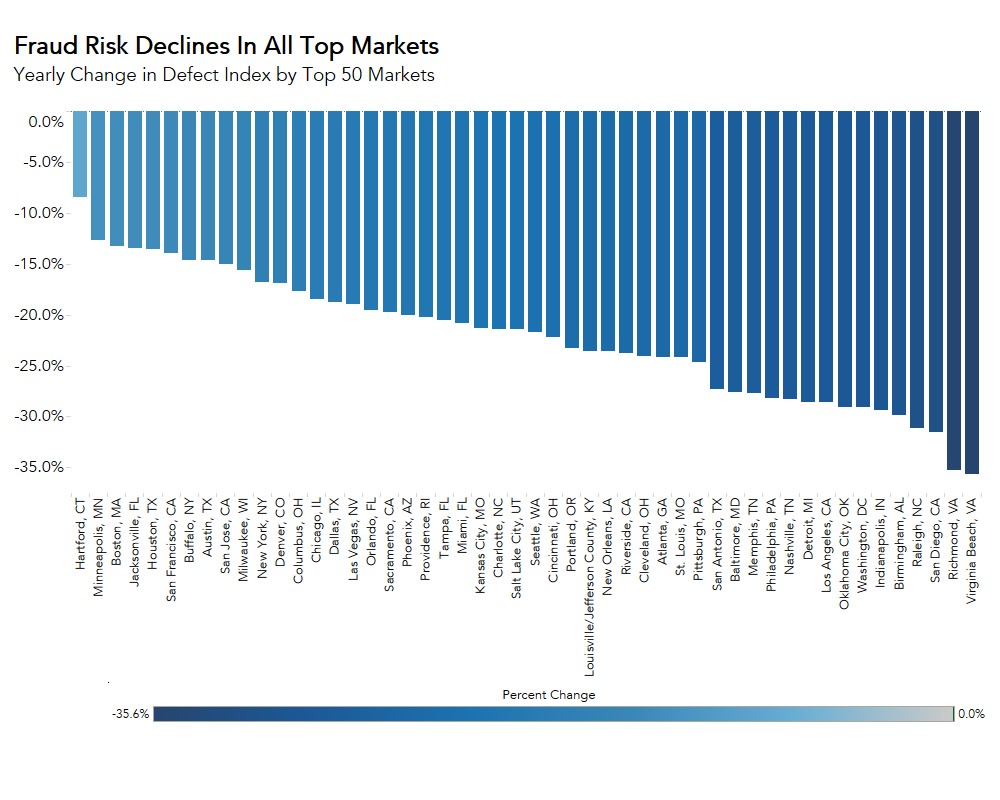
- Among the largest 50 Core Based Statistical Areas (CBSAs), the five markets with the greatest year-over-year increase in defect frequency are: Richmond, Va. (+33.8 percent), Pittsburgh (+29.2 percent), Buffalo, N.Y. (+26.5 percent), San Jose, Calif. (+26.5 percent), and Hartford, Conn. (+25.4 percent).
- Among the largest 50 Core Based Statistical Areas (CBSAs), the five markets with the largest year-over-year decrease in defect frequency are: Jacksonville, Fla. (-13.3 percent), Houston (-11.5 percent), Orlando, Fla. (-7.3 percent), Tampa, Fla. (-5.3 percent), and Miami (-4.8 percent).


