In March, data began to reveal the depth of the impact from the pandemic on the housing market. The number of existing-home sales fell 8.5 percent relative to February, and the number of new listings continued to dwindle. While historically low mortgage rates make it more affordable for those with stable incomes to buy a home, tightening credit standards make it more difficult for some to obtain financing and many home buyers struggle to find the home they want due the limited inventory of homes for sale.
“Except in a few markets in California, median house-buying power exceeds the median sale price in many markets. The trick is finding something to buy.”
Many still bear scars from the Great Recession and may expect the housing market to follow a similar trajectory in response to the pandemic. Yet, there are several key differences between “then” and “now,” one of which is that housing was overvalued on the eve of the Great Recession, but today house-buying power nationally is nearly double the median sale price of a home. However, as the adage goes, it’s all about “location, location, location,” so let’s examine the extent of housing overvaluation at the market level.
California Markets Overvalued
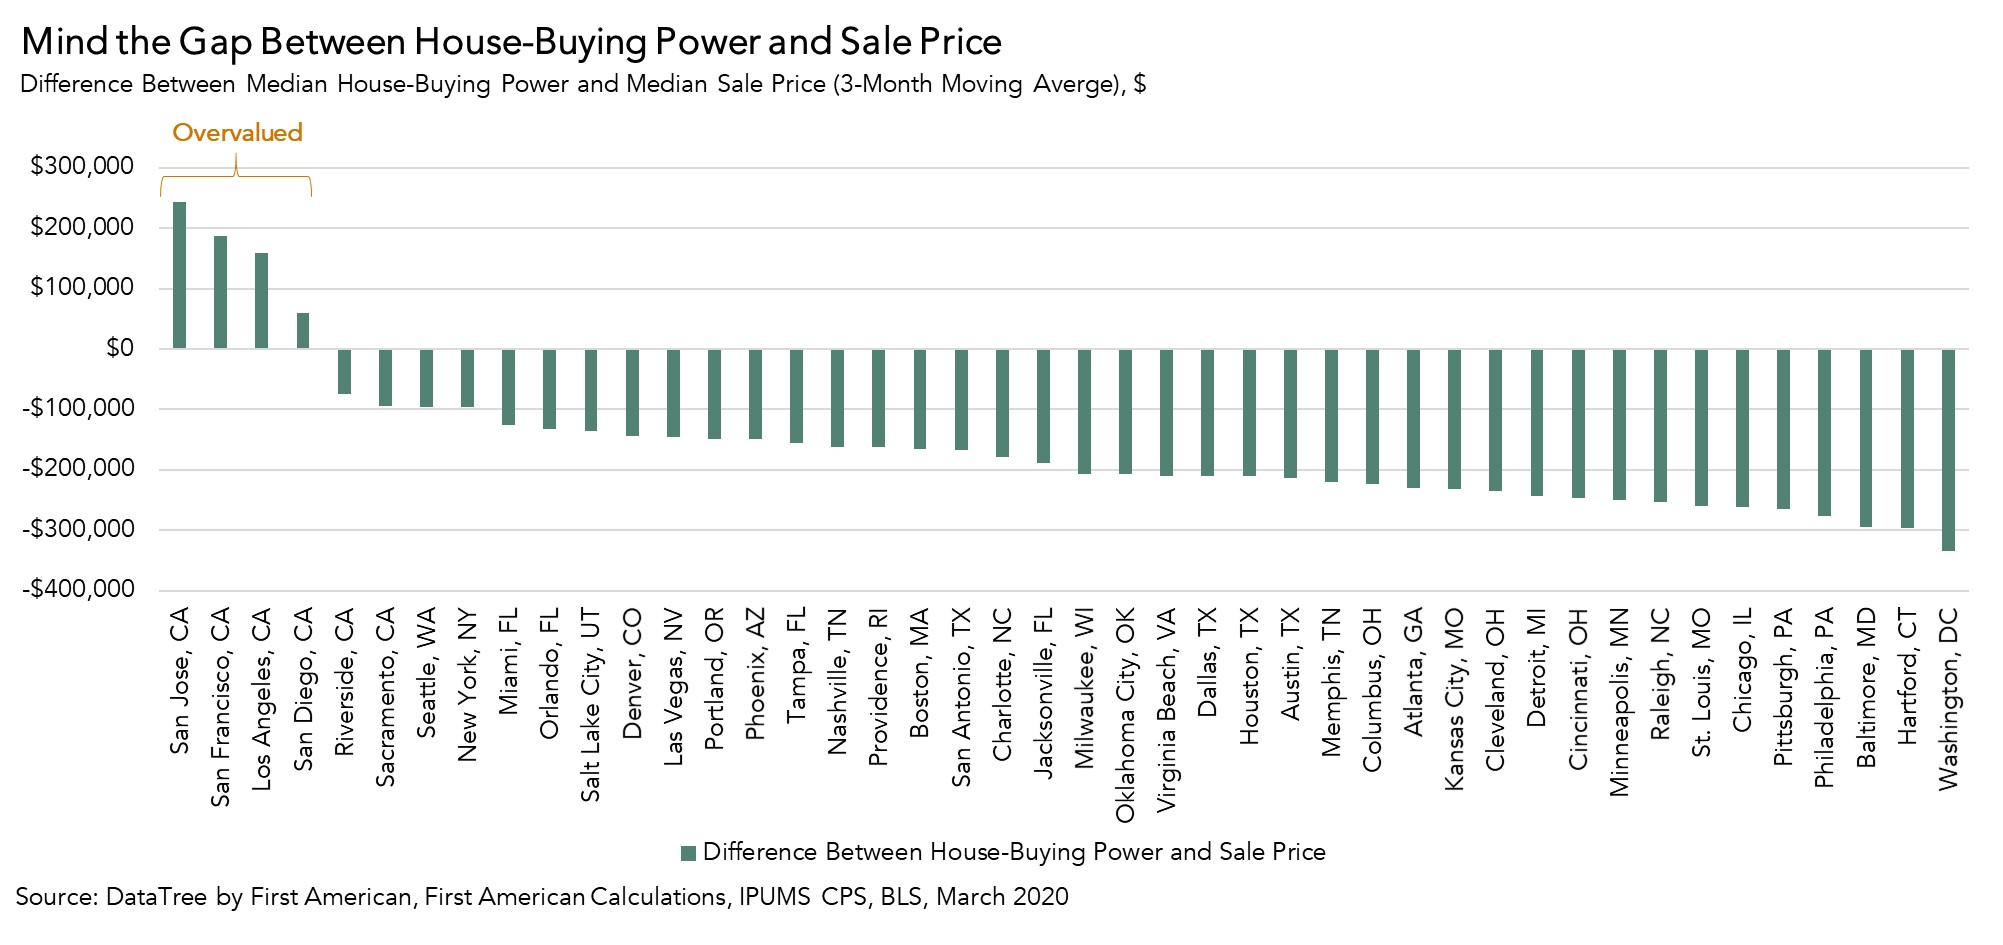
One measure of overvaluation is comparing the median sale price of a home in a given market with the median house-buying power – how much one can buy based on changes in income and interest rates. If housing is appropriately valued, median house-buying power should equal or exceed the median sale price of a home. In March 2020, only four of the 44 markets we track were overvalued by this measure. All four overvalued markets are in California and the San Jose was the most overvalued market. In San Jose, the median house-buying power in March was approximately $827,000, significantly below the median sale price of a home at $1.07 million. San Francisco, Los Angeles, and San Diego were also overvalued, although to a lesser extent.
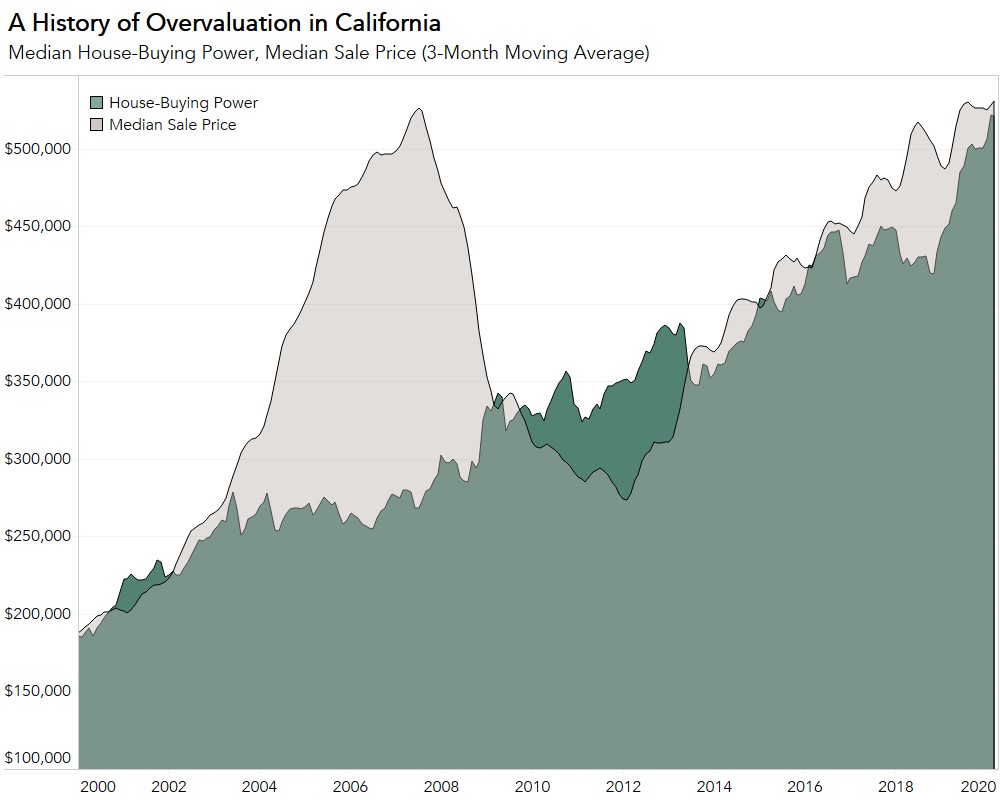
The graph below shows there were only two time periods in the last 20 years when the California housing market was not overvalued: from 2000 through 2002 and 2009 through 2013. Overvaluation of housing in California peaked in July 2007, when the median sale price of a home was nearly double the median house-buying power. Today, the gap is much narrower, indicating that even in California, housing is in a better position now than it was at the onset of the Great Recession.
Most Markets Are Not Overvalued
With the exception of the four California markets, the remaining 40 markets we track are not considered overvalued. In fact, in March 2020, the average percent difference between median house-buying power and the median sale price of a home in these 40 markets was 58 percent. Rising household income and a historically low mortgage rate environment has propelled house-buying power growth, outpacing house price appreciation. Nationally, strong median house-buying power relative to median sale price implies that housing is not overvalued today. Even at the market level, housing overvaluation is not as prevalent as many believe. The challenge for home buyers is finding something to buy.
March 2020 Real House Price Index
In March 2020, the month the pandemic took hold in the U.S., the Real House Price Index (RHPI) began to show signs of an impact on affordability. While still more affordable than one year ago, the RHPI increased 1.1 percent month over month, a sign of reduced affordability. Compared with February 2020, the 30-year, fixed-rate mortgage fell by 0.02 percentage points. Yet, household income fell by 0.3 percent compared with February, so consumer house-buying power – how much one can buy based on changes in income and interest rates – declined 0.1 percent compared with last month. The decline in house-buying power, combined with continued acceleration in nominal monthly house price appreciation, fueled the monthly increase in the RHPI (affordability declined).
For more analysis of affordability, please visit the Real House Price Index.
The RHPI is updated monthly with new data. Look for the next edition of the RHPI the week of June 29, 2020.
Sources:
March 2020 Real House Price Index Highlights
The First American Real House Price Index (RHPI) showed that in March 2020:
- Real house prices increased 1.1 percent between February 2020 and March 2020.
- Real house prices declined 4.7 percent between March 2019 and March 2020.
- Consumer house-buying power, how much one can buy based on changes in income and interest rates, decreased 0.1 percent between February 2020 and March 2020, and increased 12.5 percent year over year.
- Median household income has increased 1.9 percent since March 2019 and 59.2 percent since January 2000.
- Real house prices are 18.4 percent less expensive than in January 2000.
- While unadjusted house prices are now 11.5 percent above the housing boom peak in 2006, real, house-buying power-adjusted house prices remain 42.1 percent below their 2006 housing boom peak.
March 2020 Real House Price State Highlights
- The only state with a year-over-year increase in the RHPI is: Rhode Island (+0.2 percent).
- The five states with the greatest year-over-year decrease in the RHPI are: Hawaii (-9.5 percent), California (-8.7 percent), New Mexico (-8.7 percent), Illinois (-8.4 percent), and Utah (-7.8 percent).
March 2020 Real House Price Local Market Highlights
- Among the Core Based Statistical Areas (CBSAs) tracked by First American, the only market with a year-over-year increase in the RHPI is: Cleveland (+0.4 percent).
- Among the Core Based Statistical Areas (CBSAs) tracked by First American, the five markets with the greatest year-over-year decrease in the RHPI are: San Francisco (-12.0 percent), Las Vegas (-10.4 percent), Boston (-9.5 percent), San Jose, Calif. (-9.4 percent), and Baltimore (-9.4 percent).
About the First American Real House Price Index
The traditional perspective on house prices is fixated on the actual prices and the changes in those prices, which overlooks what matters to potential buyers - their purchasing power, or how much they can afford to buy. First American’s proprietary Real House Price Index (RHPI) adjusts prices for purchasing power by considering how income levels and interest rates influence the amount one can borrow.
The RHPI uses a weighted repeat-sales house price index that measures the price movements of single-family residential properties by time and across geographies, adjusted for the influence of income and interest rate changes on consumer house-buying power. The index is set to equal 100 in January 2000. Changing incomes and interest rates either increase or decrease consumer house-buying power. When incomes rise and mortgage rates fall, consumer house-buying power increases, acting as a deflator of increases in the house price level. For example, if the house price index increases by three percent, but the combination of rising incomes and falling mortgage rates increase consumer buying power over the same period by two percent, then the Real House Price index only increases by 1 percent. The Real House Price Index reflects changes in house prices, but also accounts for changes in consumer house-buying power.
Disclaimer
Opinions, estimates, forecasts and other views contained in this page are those of First American’s Chief Economist, do not necessarily represent the views of First American or its management, should not be construed as indicating First American’s business prospects or expected results, and are subject to change without notice. Although the First American Economics team attempts to provide reliable, useful information, it does not guarantee that the information is accurate, current or suitable for any particular purpose. © 2020 by First American. Information from this page may be used with proper attribution.


