The housing market’s impressive “V-shaped” recovery has thus far shown significant resilience to the economic impacts of the coronavirus pandemic. Demographically driven millennial demand has continued unabated, low rates have fueled house-buying power, and historically low inventory has increased competition, leading to rising prices.
“In the game of housing musical chairs, it’s clear the housing market needs more chairs.”
Weekly mortgage applications started the first quarter of the year approximately 10 percent above year-ago levels. After reaching a pandemic-induced low point in April, mortgage applications began to accelerate and, starting in late May, have surpassed their levels from one year ago for 21 straight weeks. In September, housing market potential continued to impress, even outpacing last month’s record. Housing market potential increased to its highest level in over 13 years, largely driven by strong house price appreciation in September.
Housing Musical Chairs Boosts Market Potential
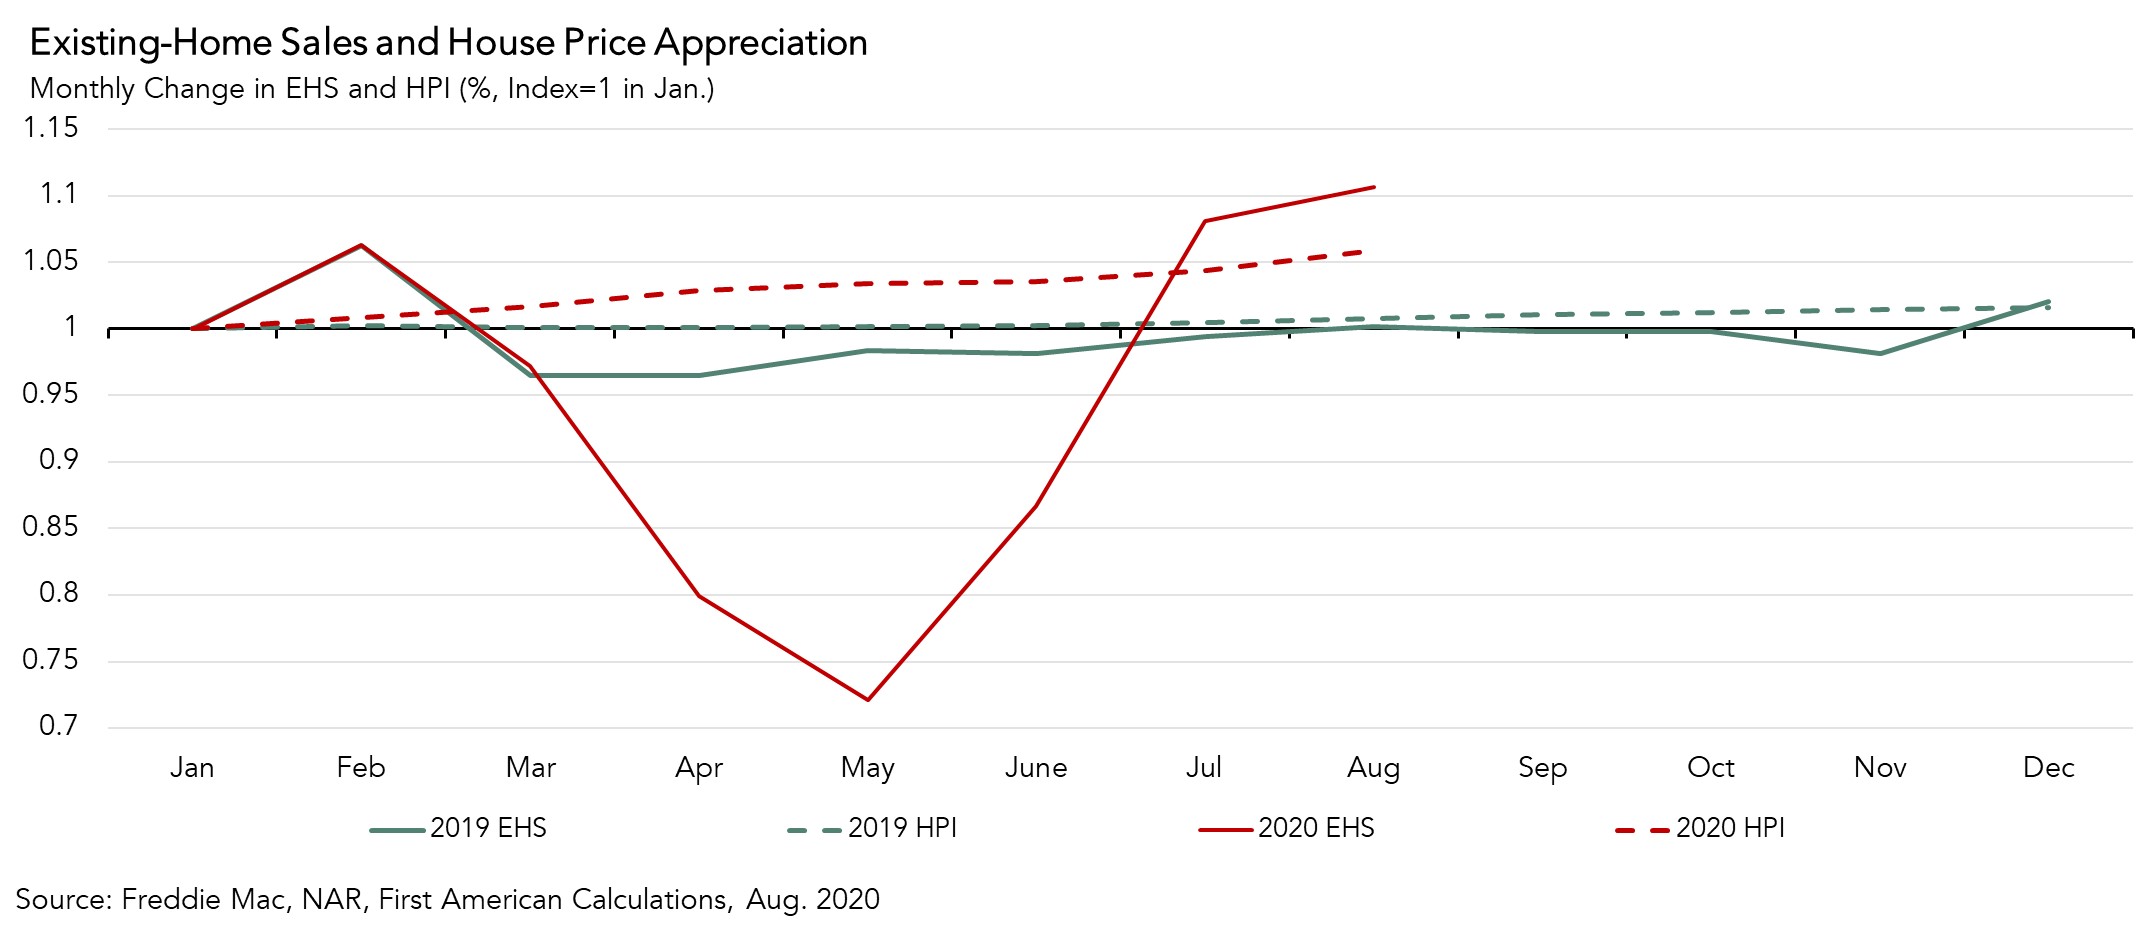
In today’s housing market, fast rising demand against the limited supply of homes for sale has resulted in faster house price appreciation. There were 1.49 million homes for sale at the end of August, down 18.6 percent annually to a 3-month supply. Homes that do come to market are often met with multiple bids, further escalating prices, but are still selling quickly. The rapid escalation of house prices has a mixed impact on home buyers, fueling strong equity gains for existing homeowners, but dampening affordability for potential first-time homebuyers.
Homeowners in areas where house prices are rising feel wealthier. American homeowners today have near-record levels of equity, and as their equity grows, they are more likely to consider using that equity to purchase a larger or more attractive home – the wealth effect of rising equity. In August’s existing-home sales report, the increase in home sales was strongest at the upper end of the market, as sales of homes priced at more than $1 million rose 44 percent nationally, followed closely by homes in the $750,000 to $1 million range, which increased 34.5 percent. Existing homeowners are playing “housing musical chairs” by selling to each other. In September, the growing wealth effect of rising equity caused by house price appreciation increased housing market potential by 26,570 potential home sales relative to one month ago, and 129,430 compared with one year ago. Accelerating house price appreciation had its greatest year-over-year contribution to the market potential for existing-home sales since 2014.
What’s Ahead for First-Time and Repeat Buyers?
Inventory in today’s housing market is so tight and demand so strong that in last month’s existing home sales report, 70 percent of all homes listed for sale were sold within the month, with days on market falling to 22 in August, down from 31 days in August 2019. The ongoing supply shortage continues to put upward pressure on house price appreciation as buyers compete to buy what little inventory is for sale. You can’t buy what’s not for sale, but you can compete for what is.
The lack of inventory and increase in house price appreciation is problematic for potential first-time home buyers, who tend to be younger and do not have the equity from the sale of an existing home to bring to the closing table. On the contrary, existing homeowners can use the equity from the sale of their current home to purchase a bigger or better home. Rapid house price appreciation and its impacts on existing and first-time home buyers will persist until the supply and demand imbalance begins to improve. In the game of housing musical chairs, it’s clear the housing market needs more chairs.
September 2020 Potential Home Sales
For the month of September, First American updated its proprietary Potential Home Sales Model to show that:
- Potential existing-home sales increased to a 6.09 million seasonally adjusted annualized rate (SAAR), a 1.5 percent month-over-month increase.
- This represents a 74.6 percent increase from the market potential low point reached in February 1993.
- The market potential for existing-home sales increased 11.8 percent compared with a year ago, a gain of nearly 641,367 (SAAR) sales.
- Currently, potential existing-home sales is 704,586 million (SAAR), or 10.4 percent below the pre-recession peak of market potential, which occurred in April 2006.
Market Performance Gap
- The market for existing-home sales underperformed its potential by 2.5 percent or an estimated 151,322 (SAAR) sales.
- The market performance gap decreased by an estimated 123,475 (SAAR) sales between August 2020 and September 2020.
First American Deputy Chief Economist Odeta Kushi contributed to this post.
What Insight Does the Potential Home Sales Model Reveal?
When considering the right time to buy or sell a home, an important factor in the decision should be the market’s overall health, which is largely a function of supply and demand. Knowing how close the market is to a healthy level of activity can help consumers determine if it is a good time to buy or sell, and what might happen to the market in the future. That is difficult to assess when looking at the number of homes sold at a particular point in time without understanding the health of the market at that time. Historical context is critically important. Our potential home sales model measures what we believe a healthy market level of home sales should be based on the economic, demographic and housing market environments.
About the Potential Home Sales Model
Potential home sales measures existing-home sales, which include single-family homes, townhomes, condominiums and co-ops on a seasonally adjusted annualized rate based on the historical relationship between existing-home sales and U.S. population demographic data, homeowner tenure, house-buying power in the U.S. economy, price trends in the U.S. housing market, and conditions in the financial market. When the actual level of existing-home sales are significantly above potential home sales, the pace of turnover is not supported by market fundamentals and there is an increased likelihood of a market correction. Conversely, seasonally adjusted, annualized rates of actual existing-home sales below the level of potential existing-home sales indicate market turnover is underperforming the rate fundamentally supported by the current conditions. Actual seasonally adjusted annualized existing-home sales may exceed or fall short of the potential rate of sales for a variety of reasons, including non-traditional market conditions, policy constraints and market participant behavior. Recent potential home sale estimates are subject to revision to reflect the most up-to-date information available on the economy, housing market and financial conditions. The Potential Home Sales model is published prior to the National Association of Realtors’ Existing-Home Sales report each month.


