August marked the first time in nearly a year that housing market potential increased on a monthly basis, increasing 2.1 percent compared with July to an estimated pace of 5.61 million at a seasonally adjusted annualized rate (SAAR). The month-over-month increase was also the largest monthly increase in housing market potential since December 2020, yet housing market potential remains 12.9 percent lower than one year ago.
“When the economic uncertainty dust settles, those buyers and sellers who were on the sideline will jump back in the housing game. Demographic trends support elevated purchase demand in the years to come, so it’s a question of when, not if, for the housing market.”
Using a dynamic simulation involving our Potential Home Sales Model, we can identify the market dynamics influencing potential existing-home sales in August relative to July and determine whether they reduce or boost housing market potential. While many dynamics can be closely monitored for their influence on the housing market, some considerations that go into the decision to buy and sell a home are personal and difficult to quantify. In August, those softer dynamics help to explain the discrepancy between the increase in housing market potential and ongoing cooling in the actual housing market.
The Forces Boosting Housing Market Potential:
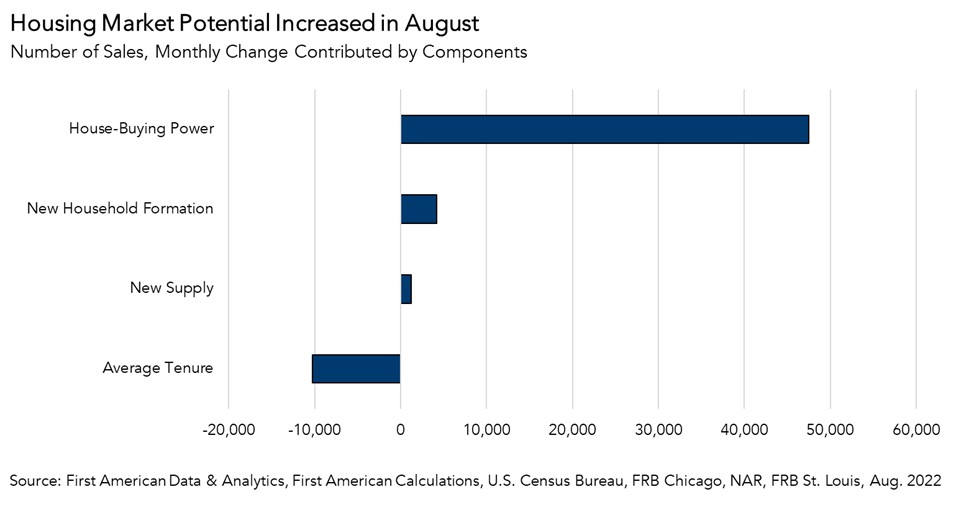
Five of the six drivers of housing market potential boosted potential home sales in August compared with one month ago. One of the primary forces fueling housing market potential in August was a modest rise in house-buying power. The 30-year fixed mortgage rate decreased by 0.19 percentage points, while median household income increased by 0.3 percent compared to one month ago. The result was a 2.5 percent increase in house-buying power, which increased housing market potential by over 47,000 sales. The welcome bounce in house-buying power is expected to fade quickly, however, as mortgage rates have once again trended upward in the early weeks of September.
Household formation, a primary and long-term driver of homebuying demand, also pushed market potential upward. Millennials are the largest generation in U.S. history and the bulk of them are aging into their prime home-buying years and forming households. Household formation continued to rise in August and contributed over 4,000 potential home sales compared with the previous month.
New-home supply also boosted potential home sales. The lack of supply and the fear of not being able to find something to buy keeps many existing homeowners from selling. Therefore, as more new-home supply enters the market, the risk of not being able to find something to buy lessens, strengthening homeowners’ confidence in the decision to sell their existing homes. Compared with last month, more new-home supply entered the market, increasing housing market potential by nearly 1,300 potential home sales.
The Forces Holding Back Housing Market Potential:
Sellers have largely been staying put, given many enjoy a mortgage rate that may be nearly three full percentage points lower than the current market for mortgage rates. Since home sellers are also prospective home buyers, homeowners choosing not to sell has reduced housing market potential by 10,000 sales compared with one month ago.
The other factor that’s likely holding back market potential, but is difficult to quantify, is economic uncertainty. Buying a home is the largest financial decision a person will likely make, and that is predicated on one’s financial security and confidence in the economy. The ongoing inflationary environment and risk of a recession with potential labor market consequences remain a concern, severely impacting consumer confidence. As potential home buyers and sellers wait out the period of economic uncertainty, purchase demand may suffer.
What Does This Mean for the Future of Housing Market Potential?
The increase in housing market potential indicates that market conditions can fundamentally support more sales compared with one month ago. But, while the August decline in mortgage rates may have given buyers a brief reprieve from the rapid rise in rates over the last several months, it may not be enough to entice potential buyers to jump back into the market during uncertain economic times. Potential sellers are also facing economic uncertainty, in addition to being rate locked-in to their homes. Yet, when the economic uncertainty dust settles, those buyers and sellers who were on the sidelines will jump back in the housing game. Demographic trends support elevated purchase demand in the years to come, so it’s a question of when, not if, for the housing market.
August 2022 Potential Home Sales
For the month of August, First American updated its proprietary Potential Home Sales Model to show that:
- Potential existing-home sales increased to a 5.61 million seasonally adjusted annualized rate (SAAR), a 2.1 percent month-over-month increase.
- This represents a 60.8 percent increase from the market potential low point reached in February 1993.
- The market potential for existing-home sales decreased 12.9 percent compared with a year ago, a loss of 832,800 (SAAR) sales.
- Currently, potential existing-home sales is 1,183,000 (SAAR), or 17.4 percent below the pre-recession peak of market potential, which occurred in April 2006.
First American Deputy Chief Economist Odeta Kushi contributed to this post.
What Insight Does the Potential Home Sales Model Reveal?
When considering the right time to buy or sell a home, an important factor in the decision should be the market’s overall health, which is largely a function of supply and demand. Knowing how close the market is to a healthy level of activity can help consumers determine if it is a good time to buy or sell, and what might happen to the market in the future. That is difficult to assess when looking at the number of homes sold at a particular point in time without understanding the health of the market at that time. Historical context is critically important. Our potential home sales model measures what we believe a healthy market level of home sales should be based on the economic, demographic and housing market environments.
About the Potential Home Sales Model
Potential home sales measures existing-home sales, which include single-family homes, townhomes, condominiums and co-ops on a seasonally adjusted annualized rate based on the historical relationship between existing-home sales and U.S. population demographic data, homeowner tenure, house-buying power in the U.S. economy, price trends in the U.S. housing market, and conditions in the financial market. When the actual level of existing-home sales are significantly above potential home sales, the pace of turnover is not supported by market fundamentals and there is an increased likelihood of a market correction. Conversely, seasonally adjusted, annualized rates of actual existing-home sales below the level of potential existing-home sales indicate market turnover is underperforming the rate fundamentally supported by the current conditions. Actual seasonally adjusted annualized existing-home sales may exceed or fall short of the potential rate of sales for a variety of reasons, including non-traditional market conditions, policy constraints and market participant behavior. Recent potential home sale estimates are subject to revision to reflect the most up-to-date information available on the economy, housing market and financial conditions. The Potential Home Sales model is published prior to the National Association of Realtors’ Existing-Home Sales report each month.


