Affordability continued to suffer in October 2022, as the Real House Price Index (RHPI) jumped up by 68 percent on an annual basis. This rapid annual decline in affordability was driven by a 12 percent annual increase in nominal house prices and a 3.8 percentage point increase in the average 30-year, fixed mortgage rate compared with one year ago. Even though household income increased 3.4 percent since October 2021 and contributed positively to consumer house-buying power, it was not enough to offset the affordability loss from the dramatic surge in mortgage rates and fast-rising nominal prices.
"Given the large loss of affordability buyers experienced this year, a possible improvement next year will be a welcome relief for potential buyers."
As affordability wanes and prompts buyers to pull back from the market, nominal house price appreciation has slowed. Nationally, annual nominal house price growth peaked in March at nearly 21 percent but has since decelerated by more than 8 percentage points to 12 percent in October. Does waning house price appreciation signal that we may be past the worst of the affordability crash and affordability may be poised to rebound in 2023?
Economic Dynamics Influencing Affordability Heading into 2023
- Income Likely to Flatten: The labor market continued to impress in October, as rising wages resulted in higher household income. Annual hourly wage growth increased by 4.9 percent compared with a year earlier, job growth is steady, and the unemployment rate remains low. The rise in wage growth contributed to a 3.4 percent year-over-year increase in median household income. Compared with October 2021, the rise in household income alone increased consumer house-buying power by approximately $16,000. But the labor market faces growing uncertainty, as the Federal Reserve continues to tighten monetary policy to curtail demand and slow inflation. Next year, it will be increasingly difficult for the Fed to fight inflation so intensely without broader impacts to employment. For now, the labor market continues to face a labor shortage, which puts upward pressure on wages and, therefore, household income. The labor shortage will likely wane in 2023, meaning the pace of wage growth will likely slow as well.
- Mortgage Rates Expected to Stabilize: Mortgage rates more than doubled in October compared with one year ago. The spike in mortgage rates from 3.07 percent last October to 6.9 percent this October reduced house-buying power by nearly $178,000, holding income constant. Partially offset by gains from household income, the net effect on house-buying power was a decline of approximately $162,000 compared with October 2021. Looking ahead to 2023, an average of industry forecasts indicates that mortgage rates are expected to end next year at approximately 6 percent, as inflation is expected to recede, which may provide a modest boost to consumer house-buying power at the end of 2023 compared with this year.
- Nominal House Prices Continue to Slow, Decline in Some Markets: Nationally, annual nominal house price appreciation will continue to slow in 2023 as the housing market adjusts to the reality of higher mortgage rates. Taking the average of different industry house price forecasts yields a 0.3 percent annual decline in nominal house price growth nationally in the fourth quarter of 2023. Price declines from recent peaks are expected to continue in many markets in early 2023 as the housing market rebalances. Affordability could be given a boost from lower house prices in 2023 compared with 2022.
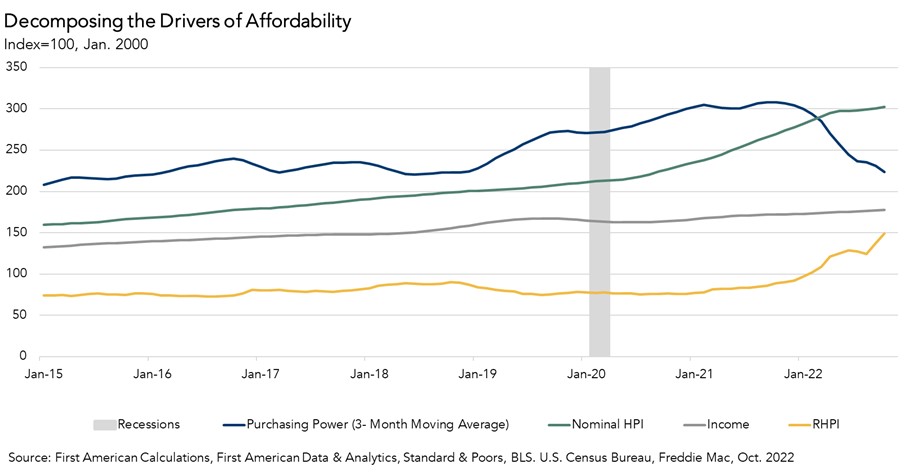
Shifting Towards a Buyers’ Market
American author John Naisbitt once said, “the most reliable way to forecast the future is to try and understand the present.” It’s true that economic forecasting is a humbling experience, but understanding the dynamics in the housing market today provides some insight into what may occur next year. If mortgage rates fall to 6 percent by the end of 2023 as the industry average predicts, household incomes remain flat on an annual basis due to a narrowing labor supply-demand gap and slowing labor market, and nominal house prices decline by 0.3 percent annually as the industry forecasts, then affordability as measured by the RHPI will improve by 9 percent by the end of next year compared with October 2022. A more affordable housing market will be welcome news for buyers currently sitting on the sidelines. Given the large loss of affordability buyers experienced this year, a possible improvement next year will be a welcome relief for potential buyers.
For more analysis of affordability, please visit the Real House Price Index. The RHPI is updated monthly with new data. Look for the next edition of the RHPI the week of January 30, 2023.
Sources:
October 2022 Real House Price Index Highlights
The First American Real House Price Index (RHPI) showed that in October 2022:
- Real house prices increased 8.7 percent between September 2022 and October 2022.
- Real house prices increased 68.1 percent between October 2021 and October 2022.
- Consumer house-buying power, how much one can buy based on changes in income and interest rates, decreased 7.5 percent between September 2022 and October 2022, and decreased 33.3 percent year over year.
- Median household income has increased 3.4 percent since October 2021 and 78 percent since January 2000.
- Real house prices are 49.5 percent more expensive than in January 2000.
- Unadjusted house prices are now 55.6 percent above the housing boom peak in 2006, while real, house-buying power-adjusted house prices are 5.5 percent above their 2006 housing boom peak.
October 2022 Real House Price State Highlights
- The five states with the greatest year-over-year increase in the RHPI are: Florida (+86.3), Georgia (+74.4 percent), Alabama (+72.6 percent), New Hampshire (+72.1 percent), and Alaska (+71.9 percent).
- There were no states with a year-over-year decrease in the RHPI.
October 2022 Real House Price Local Market Highlights
- Among the Core Based Statistical Areas (CBSAs) tracked by First American, the five markets with the greatest year-over-year increase in the RHPI are: Miami (+92.8 percent), Tampa, Fla. (+81.4 percent), Indianapolis (+79.4 percent), Jacksonville, Fla. (+77.1 percent), and Nashville, Tenn. (+75.9 percent).
- Among the Core Based Statistical Areas (CBSAs) tracked by First American, there were no markets with a year-over-year decrease in the RHPI.
About the First American Real House Price Index
The traditional perspective on house prices is fixated on the actual prices and the changes in those prices, which overlooks what matters to potential buyers - their purchasing power, or how much they can afford to buy. First American’s proprietary Real House Price Index (RHPI) adjusts prices for purchasing power by considering how income levels and interest rates influence the amount one can borrow.
The RHPI uses a weighted repeat-sales house price index that measures the price movements of single-family residential properties by time and across geographies, adjusted for the influence of income and interest rate changes on consumer house-buying power. The index is set to equal 100 in January 2000. Changing incomes and interest rates either increase or decrease consumer house-buying power. When incomes rise and mortgage rates fall, consumer house-buying power increases, acting as a deflator of increases in the house price level. For example, if the house price index increases by three percent, but the combination of rising incomes and falling mortgage rates increase consumer buying power over the same period by two percent, then the Real House Price index only increases by 1 percent. The Real House Price Index reflects changes in house prices, but also accounts for changes in consumer house-buying power.
Disclaimer
Opinions, estimates, forecasts and other views contained in this page are those of First American’s Chief Economist, do not necessarily represent the views of First American or its management, should not be construed as indicating First American’s business prospects or expected results, and are subject to change without notice. Although the First American Economics team attempts to provide reliable, useful information, it does not guarantee that the information is accurate, current or suitable for any particular purpose. © 2022 by First American. Information from this page may be used with proper attribution.


