The spring season is typically the busiest time of the year for the housing market. According to data from First America Data & Analytics, historically approximately 36 percent of existing-home sales for the year occur from March through June. The housing market’s seasonal pattern is driven by factors such as weather, holidays and the traditional school year schedule, all of which make spring and summer a more optimal time for moving for many potential home buyers. Yet, there are early signs that the spring home-buying season is off to a slow start. Comparing average mortgage applications in February of this year to February 2019 – the last “normal” year before the pandemic hit – reveals that purchase applications are down more than 30 percent.
“When existing homes for sale are nearly non-existent, a new home at the right price may be an attractive option.”
Whether the housing market remains frozen or begins to thaw during the crucial spring months is a function of many factors, ranging from mortgage rates to inventory. Our Potential Home Sales Model, which measures what we believe a healthy market for home sales should be based on the economic, demographic and housing market environments, has now increased for four consecutive months alongside generally lower mortgage rates, providing some optimism. However, even if mortgage rates stabilize and demand drifts higher, you can’t buy what’s not for sale.
You Can’t Buy What’s Not for Sale
The average 30-year, fixed mortgage rate has declined for four consecutive months since the peak in October 2022. The decline in mortgage rates has increased house-buying power, thus providing an affordability boost for potential first-time buyers and encouraging some who previously felt “rate locked-in” to re-enter the market. Yet, those who are jumping back into the market are finding that there are very few existing homes available for sale. However, there is an alternative to purchasing an existing home - buying a new home.
Homebuilders are More Motivated to Sell than Homeowners
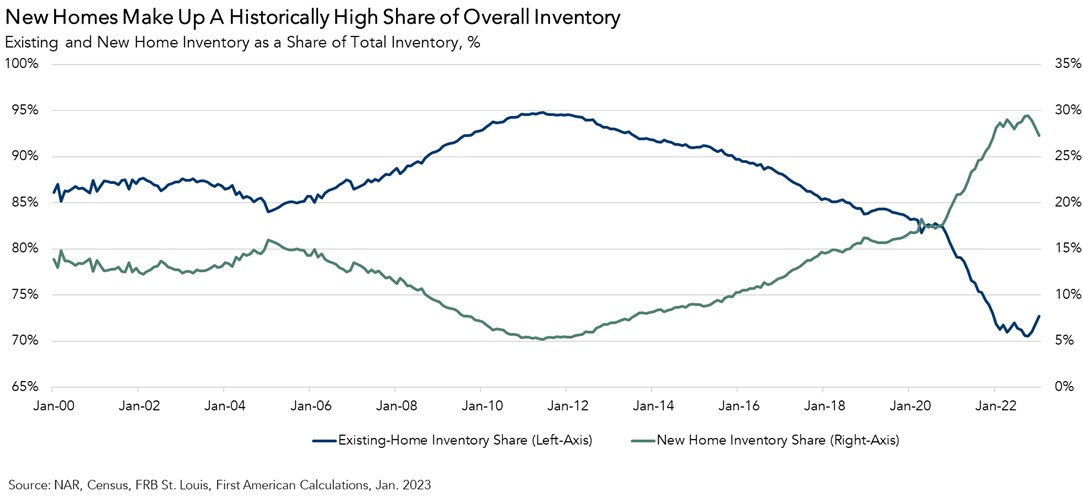
New home inventory as a share of total home inventory has increased rapidly since 2020, because homebuilders have built more homes and the supply of existing homes for sale has contracted. From 2000 until the pandemic, new homes on average made up about 11 percent of total inventory. In the January 2023 report, that share of new homes reached 27 percent. The reason why inventory is higher for new homes versus existing homes comes down to the seller. In an existing-home transaction, the seller is the homeowner, whereas in a new-home transaction, it’s a builder.
When mortgage rates spike, as they have done over the last year, homeowners can choose to stay put for a while, especially when they are sitting on a cheap mortgage and are reluctant to drop the sale price of their existing home to attract potential buyers in a higher rate environment. On the other hand, builders are incentivized to move inventory as quickly as possible and therefore can be more flexible in a higher rate environment. For instance, builders can more easily offer incentives to bolster sales (such as rate buydowns, paying points and offering price reductions), or upgrades on appliances and other quality features. This essentially allows the buyer to get more home for the same amount of money.
It is important to note that, while new home inventory has increased, only 15.5 percent of the total new home inventory as of the latest January report are completed and ready to occupy, down from more than 20 percent pre-pandemic. Nevertheless, when existing homes for sale are nearly non-existent, a new home at the right price may be an attractive option.
February 2023 Potential Home Sales
For the month of February, First American updated its proprietary Potential Home Sales Model to show that:
- Potential existing-home sales increased to a 5.47 million seasonally adjusted annualized rate (SAAR), a 2.6 percent month-over-month increase.
- This represents a 56.7 percent increase from the market potential low point reached in February 1993.
- The market potential for existing-home sales decreased 11.4 percent compared with a year ago, a loss of 702,000 (SAAR) sales.
- Currently, potential existing-home sales is 1,325,700 (SAAR), or 19.5 percent below the pre-recession peak of market potential, which occurred in April 2006.
First American Deputy Chief Economist Odeta Kushi contributed to this post.
What Insight Does the Potential Home Sales Model Reveal?
When considering the right time to buy or sell a home, an important factor in the decision should be the market’s overall health, which is largely a function of supply and demand. Knowing how close the market is to a healthy level of activity can help consumers determine if it is a good time to buy or sell, and what might happen to the market in the future. That is difficult to assess when looking at the number of homes sold at a particular point in time without understanding the health of the market at that time. Historical context is critically important. Our potential home sales model measures what we believe a healthy market level of home sales should be based on the economic, demographic and housing market environments.
About the Potential Home Sales Model
Potential home sales measures existing-home sales, which include single-family homes, townhomes, condominiums and co-ops on a seasonally adjusted annualized rate based on the historical relationship between existing-home sales and U.S. population demographic data, homeowner tenure, house-buying power in the U.S. economy, price trends in the U.S. housing market, and conditions in the financial market. When the actual level of existing-home sales are significantly above potential home sales, the pace of turnover is not supported by market fundamentals and there is an increased likelihood of a market correction. Conversely, seasonally adjusted, annualized rates of actual existing-home sales below the level of potential existing-home sales indicate market turnover is underperforming the rate fundamentally supported by the current conditions. Actual seasonally adjusted annualized existing-home sales may exceed or fall short of the potential rate of sales for a variety of reasons, including non-traditional market conditions, policy constraints and market participant behavior. Recent potential home sale estimates are subject to revision to reflect the most up-to-date information available on the economy, housing market and financial conditions. The Potential Home Sales model is published prior to the National Association of Realtors’ Existing-Home Sales report each month.


