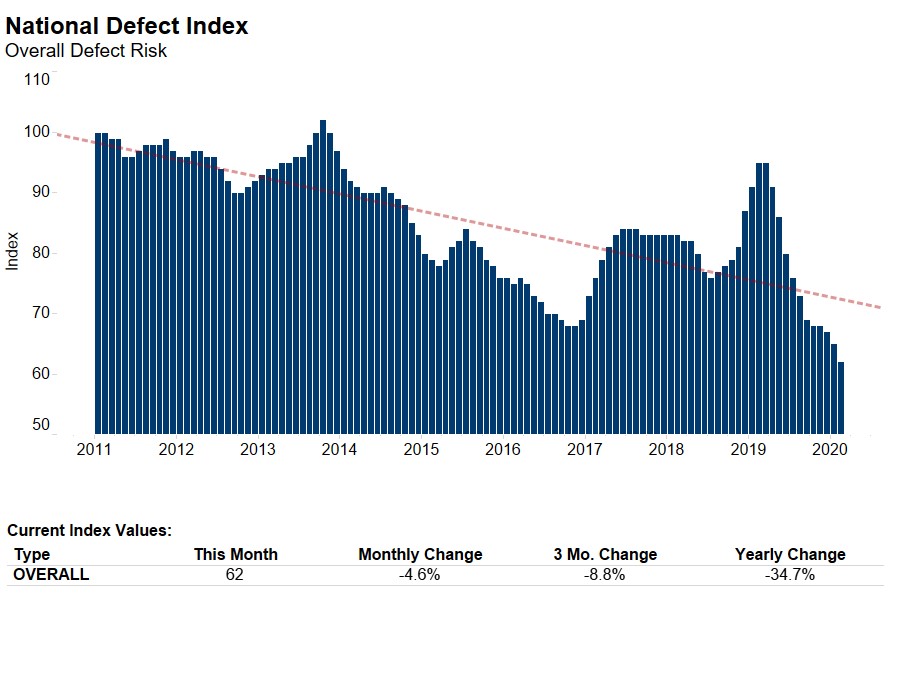
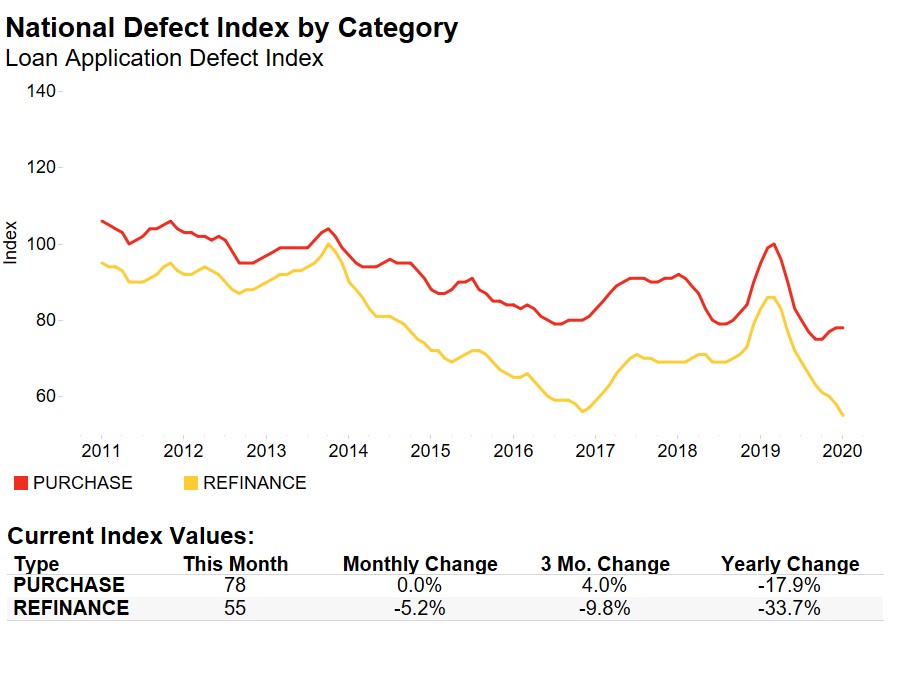
Declining for the sixth consecutive month, the Loan Application Defect Index for purchase transactions fell 2.6 percent in September compared with August. The Defect Index for refinance transactions also fell, declining 4.5 percent compared with the previous month. The overall Defect Index, which includes both purchase and refinance transactions, fell 5.5 percent compared with last month, and is 11.5 percent lower than one year ago.
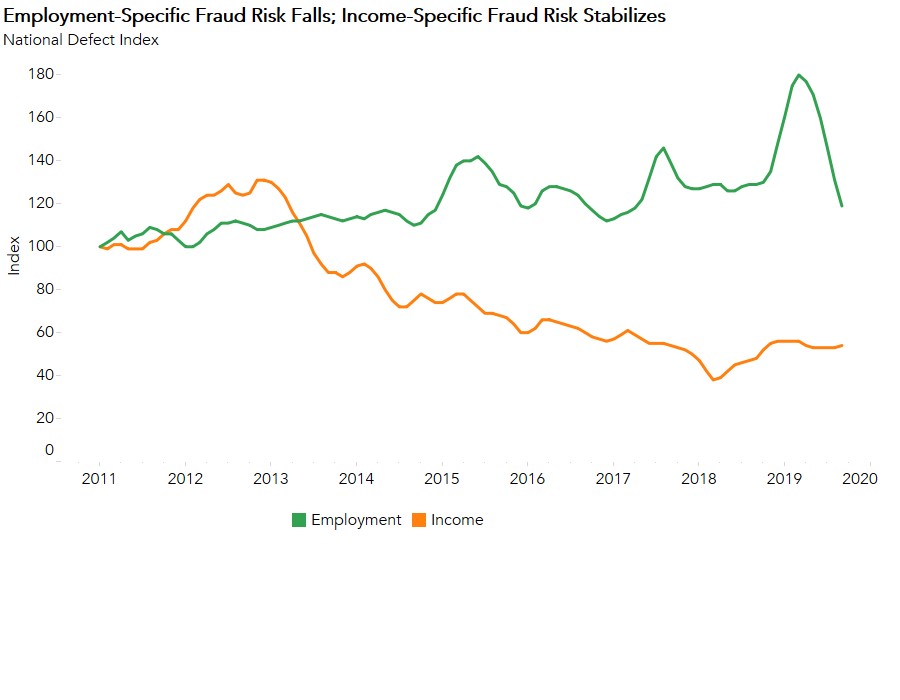
“The strong economy combined with declining mortgage rates in 2019 resulted in falling income- and employment-specific defect risk.”
The overall Defect Index has not been this low since December 2016. In fact, the Defect Index for purchase transactions reached an impressive milestone – the lowest point since we began tracking defect risk for purchase transactions in January 2011. It’s no coincidence that the broader U.S. economy has also hit some impressive milestones. The current economic expansion extended the longest economic expansion in history by another month in September. And, unemployment fell to 3.5 percent in September, which marked the 19th consecutive month at, or below, 4 percent unemployment. The unemployment rate is the lowest it has been since 1969 – over 50 years ago.
The strong economy has driven the tight labor market and the competition among employers for workers has fueled wage growth. Wage growth pushes household income upward, which was 2.4 percent higher in September compared with one year ago. But, what is the connection between a strong economy and fraud risk?
Economy Up, Fraud Down?
While the rising share of refinance transactions and weakening sellers’ market conditions have helped reduce fraud risk in 2019, there are some other factors at play as well. Rising household income driven by the strong labor market and lower mortgage rates have increased consumer house-buying power and helped boost consumer confidence. As consumer house-buying power and consumer confidence swell amid the strong labor market, the pressure to misrepresent income and employment in mortgage applications declines.
The data in our employment- and income-specific defect indices reflect this dynamic. Employment fraud risk has steadily declined since March 2019 and employment-specific fraud risk was 9.2 percent lower in September than August, and 7.8 percent less than a year ago. Additionally, income-specific fraud risk in September was 12.5 percent lower compared with one year ago.
So far, both the economy and fraud risk have reached positive milestones in 2019. The pattern seems clear – as long as the economy trends up, fraud risk trends down.
For Mark’s full analysis on loan defect risk, the top five states and markets with the greatest increases and decreases in defect risk, and more, please visit the Loan Application Defect Index.
The Defect Index is updated monthly with new data. Look for the next edition of the Defect Index the week of November 25, 2019.
September 2019 Loan Application Defect Index
The First American Loan Application Defect Index showed that in September 2019:
- The frequency of defects, fraudulence and misrepresentation in the information submitted in mortgage loan applications decreased by 5.5 percent compared with the previous month.
- Compared with September 2018, the Defect Index decreased by 11.5 percent.
- The Defect Index is down 32.4 percent from the high point of risk in October 2013.
- The Defect Index for refinance transactions decreased by 4.5 percent compared with the previous month and is down 10.0 percent compared with a year ago.
- The Defect Index for purchase transactions decreased by 2.6 percent compared with the previous month and is down 6.3 percent compared with a year ago.
September 2019 State Highlights
- The five states with a year-over-year increase in defect frequency are: South Dakota (+11.1 percent), Nebraska (+9.3 percent), New York (+6.3 percent), Iowa (+5.1 percent), and Wisconsin (+1.3 percent).
- The five states with the greatest year-over-year decrease in defect frequency are: Alaska (-21.4 percent), Florida (-19.1 percent), Texas (-18.8 percent), Virginia (-18.3 percent), and New Hampshire (-16.7 percent).
September 2019 Local Market Highlights
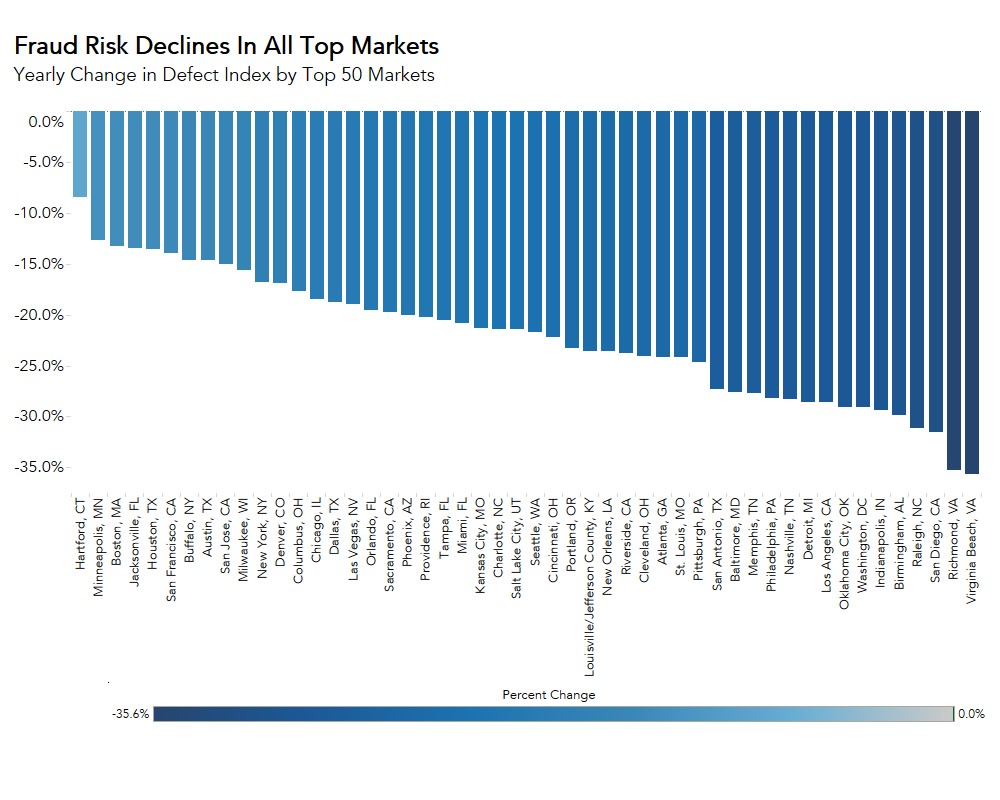
- Among the largest 50 Core Based Statistical Areas (CBSAs), the only three markets with a year-over-year increase in defect frequency are: Hartford, Conn. (+3.1 percent), Buffalo, N.Y. (+1.4 percent), and Kansas City, Mo. (+1.3 percent).
- Among the largest 50 Core Based Statistical Areas (CBSAs), the five markets with the greatest year-over-year decrease in defect frequency are: San Diego (-24.4 percent), Orlando, Fla. (-23.3 percent), Houston (-23.3 percent), Virginia Beach, Va. (-22.0 percent), and San Antonio (-20.5 percent).
Methodology
The First American Loan Application Defect Index estimates the level of defects detected in the information submitted in mortgage loan applications processed by the First American FraudGuard® system. The index is based on the frequency with which defect indicators are identified. The Defect Index moves higher as greater numbers of defect indicators are identified. An increase in the index indicates a rising level of loan application defects. The index, nationally and in all markets, is benchmarked to a value of 100 in January 2011. Therefore, all index values can be interpreted as the percentage change in defect frequency relative to the defect frequency identified nationally in January 2011.