This month, the Loan Application Defect Index for purchase transactions continued its downward trend, declining 7.8 percent in June compared with the month before, the third consecutive month defect risk in purchase transactions has fallen. The Defect Index for refinance transactions also fell 6.5 percent compared with the previous month. The overall Defect Index, which includes both purchase and refinance transactions, fell 7.0 percent compared with last month, but remains 3.9 percent higher than one year ago. Yet, is declining loan application misrepresentation, defect and fraud risk isolated to a few markets, or is the trend more geographically broad based?
“As the saying goes – a rising tide lifts all boats – and Florida is getting a bit of an extra lift this month.”
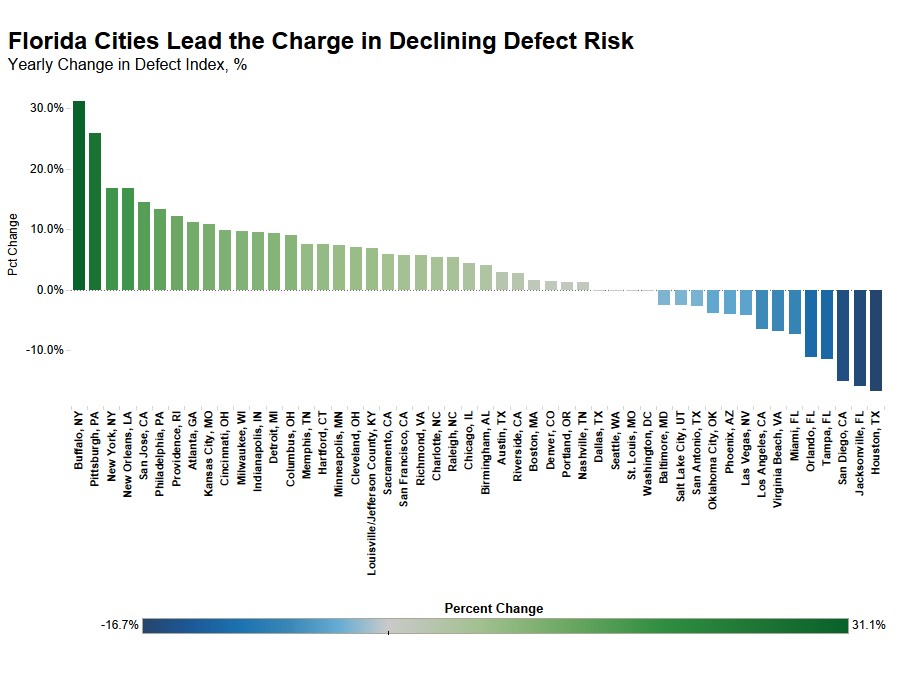
Florida Cities Lead the Charge
The Defect Index also measures loan application misrepresentation, defect and fraud risk over time in 50 of the largest markets in the U.S. Florida cities claimed four of the top six spots among the top cities where fraud risk declined the most on an annual basis: Jacksonville (-15.1 percent), Tampa (-11.5 percent), Orlando (-11.1 percent), and Miami (-7.3 percent). At the state level, Florida ranked second for the greatest year-over-year decline in fraud risk (-6.7 percent).
This is a deviation from the norm, as Florida has historically exhibited a relatively greater concentration of fraud risk due to some characteristics of the Florida housing market. Florida tends to have a higher percentage of investor-owned properties, which have a higher propensity for fraud risk. Indeed, according to the Defect Index in June 2019, applications for investment properties were 24 percent riskier than for owner-occupied properties, and applications for multi-unit properties, a popular purchase for investors, were 11 percent more likely to contain defects than applications for single-family homes.
Another possible explanation for why transactions involving investor-owned properties tend to carry greater fraud risk is that investors can claim they are purchasing a property as a second home (to capitalize on lower rates), when they actually plan to rent it out as an investment property. High levels of income misrepresentation and undisclosed mortgage debt have also been a reason for the particularly high levels of fraud risk concentrated in Florida.
Additionally, according to data from DataTree by First American, the number of condo existing-home sales has fallen in Miami, Orlando, and Tampa compared with last year. Statewide, condo existing-home sales in Florida have fallen nearly 14 percent compared with one year ago, which is counter to the national trend. Loan applications for condos and multi-family properties have historically been riskier than single-family properties, so fewer condo and multi-family transactions may help explain the decline in fraud risk in Florida.
While there are several possible explanations for the decline in fraud in Florida markets, there is one phenomenon that is working to reduce fraud in every market – the decline of the sellers’ market. As mortgage rates fall and the strong labor markets persists, potential home buyers feel less pressure to misrepresent information on a loan application. As the saying goes – a rising tide lifts all boats – and Florida is getting a bit of an extra lift this month.
For Mark’s full analysis on loan defect risk, the top five states and markets with the greatest increases and decreases in defect risk, and more, please visit the Loan Application Defect Index.
The Defect Index is updated monthly with new data. Look for the next edition of the Defect Index the week of August 26, 2019.
June 2019 Loan Application Defect Index
The First American Loan Application Defect Index showed that in June 2019:
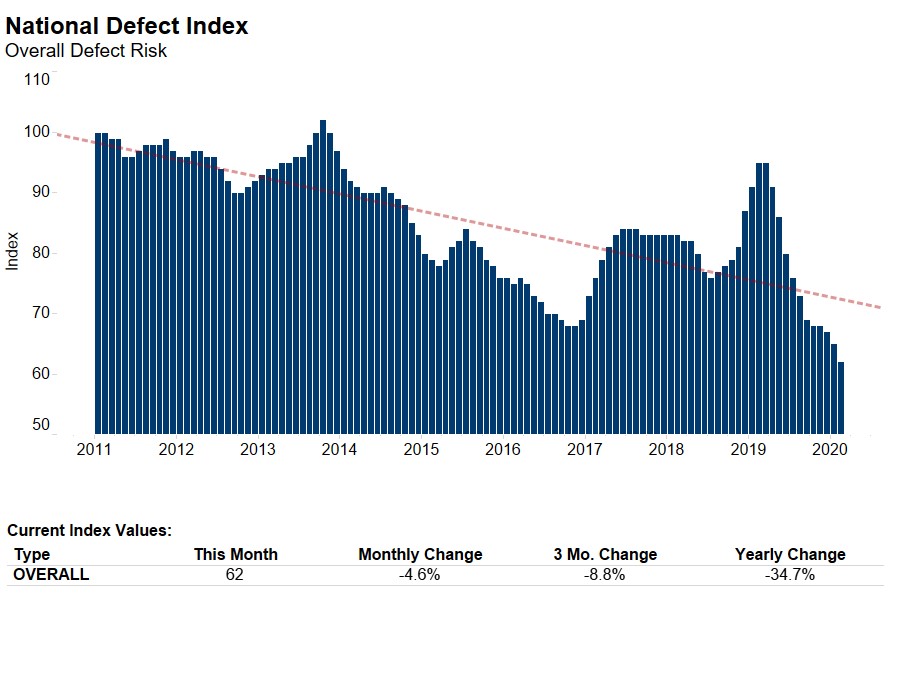
- The frequency of defects, fraudulence and misrepresentation in the information submitted in mortgage loan applications decreased by 7.0 percent compared with the previous month.
- Compared to June 2018, the Defect Index increased by 3.9 percent.
- The Defect Index is down 21.6 percent from the high point of risk in October 2013.
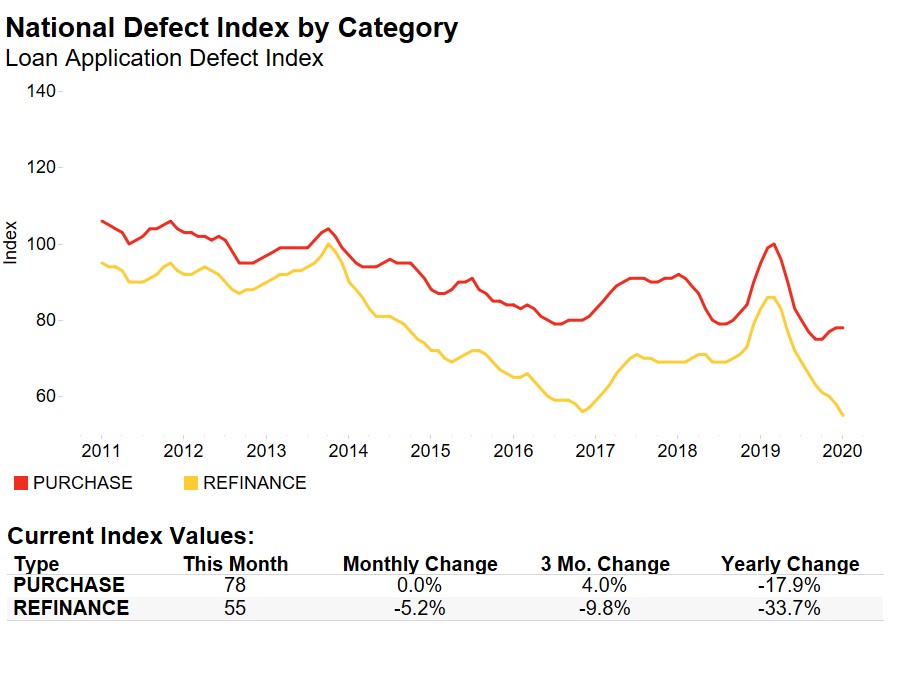
- The Defect Index for refinance transactions decreased by 6.5 percent compared with the previous month, and is up 4.3 percent compared with a year ago.
- The Defect Index for purchase transactions decreased by 7.8 percent compared with the previous month, and is up 3.8 percent compared with a year ago.
June 2019 State Highlights
- The five states with a year-over-year increase in defect frequency are: Nebraska (+34.8 percent), Iowa (+25.7 percent), New York (+25.3 percent), Pennsylvania (+19.7 percent), and Rhode Island (+19.1 percent).
- The five states with a year-over-year decrease in defect frequency are: Arkansas (-10.3 percent), Florida (-6.7 percent), Vermont (-5.1 percent), Utah (-4.8 percent), and Arizona (-4.0 percent).
June 2019 Local Market Highlights
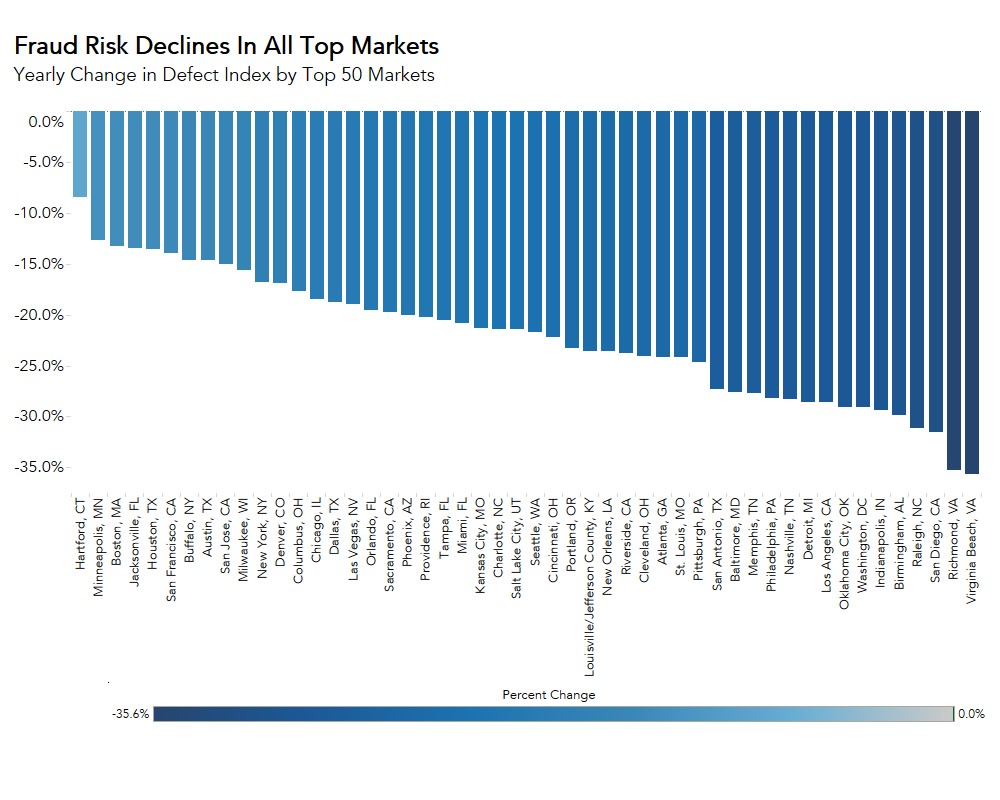
- Among the largest 50 Core Based Statistical Areas (CBSAs), the five markets with the greatest year-over-year increase in defect frequency are: Buffalo, N.Y. (+31.1 percent), Pittsburgh (+25.9 percent), New York (+16.9 percent), New Orleans (+16.9 percent), and San Jose, Calif. (+14.5 percent).
- Among the largest 50 Core Based Statistical Areas (CBSAs), the five markets with year-over-year decrease in defect frequency are: Houston (-16.7 percent), Jacksonville, Fla. (-15.9 percent), San Diego (-15.1 percent), Tampa, Fla. (-11.5 percent), and Orlando, Fla. (-11.1 percent).
Methodology
The First American Loan Application Defect Index estimates the level of defects detected in the information submitted in mortgage loan applications processed by the First American FraudGuard® system. The index is based on the frequency with which defect indicators are identified. The Defect Index moves higher as greater numbers of defect indicators are identified. An increase in the index indicates a rising level of loan application defects. The index, nationally and in all markets, is benchmarked to a value of 100 in January 2011. Therefore, all index values can be interpreted as the percentage change in defect frequency relative to the defect frequency identified nationally in January 2011.