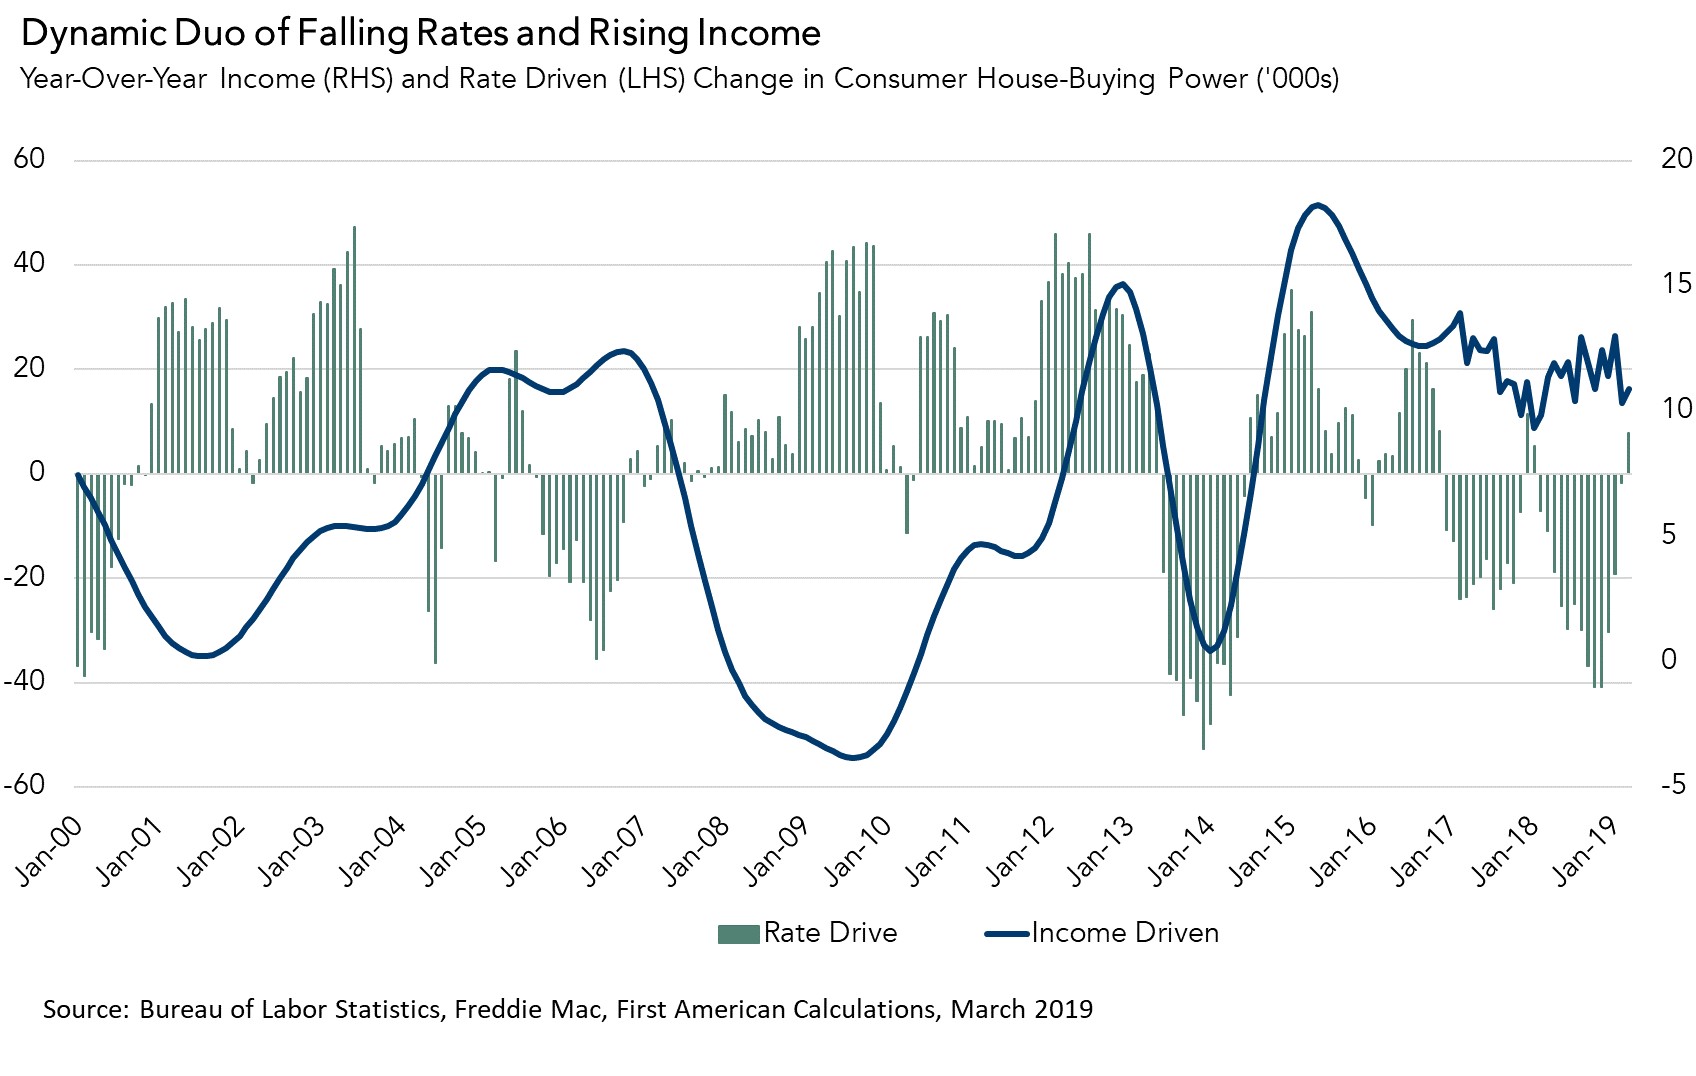
What began as a modest shift toward a buyers’ market in six cities last month has expanded into a national shift in affordability. The shift is a departure from the long-term trend in the Real House Price Index (RHPI), which had been steadily increasing throughout the rising mortgage rate environment that began in 2017 and continued until late 2018. Rising mortgage rates caused consumer house-buying power to decline at the same time as tight supply pushed house prices up rapidly.
In March, two main components of the RHPI swung in favor of increased affordability – continued strong household income growth and declining mortgage rates. Nationally, affordability improved on a year-over-year basis for the first time since 2016.
House-Buying Power Soars to 2017 Levels
In March, nominal house price appreciation increased to 5.2 percent compared with March 2018, after an 11-month slowdown. Yet, despite nominal house price acceleration, real house prices fell. The reason? Declining mortgage rates and rising household income worked together to boost consumer house-buying power sufficiently to overcome the drag on affordability from rising nominal house prices.
Consumer house-buying power climbed to $383,700 in March, 1.5 percent higher than last month and 5.2 percent higher than one year ago, reaching the highest level since December 2017. Mortgage rates in March fell to 4.27 percent, or 0.17 percentage points lower than one year ago. The decline in mortgage rates increased house-buying power by $7,800 since March 2018. Over the same period, household income grew by 3.0 percent, which boosted consumer house-buying power by nearly $11,000. The net effect? Overall, consumer house-buying power increased by nearly $19,000 in March compared with one year ago.

Falling Real House Prices in More Markets
Given the trend nationally, it’s no surprise that more markets experienced falling real house prices. In last month’s report, we identified the six cities that saw year-over-year declines in the RHPI, but this month 15 of the 44 markets we track experienced a year-over-year decline in the RHPI, and 43 out of 44 markets experienced quarterly declines. The clear trend is affordability levels are improving in more parts of the country.
Surging consumer house-buying power is increasing demand, as can be seen in the continued increase in purchase applications. But, unless supply can keep pace with demand, we should expect nominal house price appreciation to pick up. The housing market, while different in many respects, still reacts to tight supply and rising demand the old-fashioned way – with faster price appreciation.
The RHPI is updated monthly with new data. Look for the next edition of the RHPI the week of June 24, 2019.
March 2019 Real House Price Index Highlights
The First American Real House Price Index (RHPI) showed that in March 2019:
- Real house prices decreased 0.9 percent between February 2019 and March 2019.
- Real house prices declined 0.04 percent between March 2018 and March 2019.
- Consumer house-buying power, how much one can buy based on changes in income and interest rates, increased 1.5 percent between February 2019 and March 2019, and increased 5.2 percent year over year.
- Average household income has increased 3.0 percent since March 2018 and 56.0 percent since January 2000.
- Real house prices are 15.0 percent less expensive than in January 2000.
- While unadjusted house prices are now 2.6 percent above the housing boom peak in 2006, real, house-buying power-adjusted house prices remain 40.0 percent below their 2006 housing boom peak.
March Real House Price State Highlights
- The five states with the greatest year-over-year increase in the RHPI are: Wisconsin (+4.6 percent), New Hampshire (+3.9 percent), Ohio (+3.7 percent), Missouri (+3.0 percent), and Alaska (+3.0 percent).
- The five states with the greatest year-over-year decrease in the RHPI are: Wyoming (-6.9 percent), West Virginia (-4.1 percent), Louisiana (-4.1 percent), Alabama (-4.0 percent), and Oklahoma (-3.7 percent).
March 2019 Real House Price Local Market Highlights
- Among the Core Based Statistical Areas (CBSAs) tracked by First American, the five markets with the greatest year-over-year increase in the RHPI are: Columbus, Ohio (+5.9 percent), Providence, R.I. (+5.5 percent), Salt Lake City (+5.1 percent), Atlanta (+3.7 percent), and Cincinnati (+3.6 percent).
- Among the Core Based Statistical Areas (CBSAs) tracked by First American, the five markets with the greatest year-over-year decrease in the RHPI are: San Jose, Calif. (-7.6 percent), Seattle (-6.4 percent), San Francisco (-4.4 percent), Portland, Ore. (-3.9 percent), and Los Angeles (-3.1 percent).


