Throughout 2018, consistent growth among three driving forces – mortgage rates, household income and unadjusted house prices – defined the housing market. These three factors are also the core elements of the Real House Price Index (RHPI). While household income rose steadily in 2018, rising mortgage rates offset any affordability benefit for home buyers, as illustrated by 11.1 percent year-over-year growth in the RHPI. However, the first quarter of 2019 has been friendly to potential home buyers, as declining mortgage rates, ongoing household income growth and moderating unadjusted home prices has boosted affordability.
“Data on the movement of unadjusted house prices during the early spring home-buying season won’t be available for a few more months, but it’s quite likely that price appreciation will accelerate again.”
Market Dynamics Shifting Toward Home Buyers
In February, mortgage rates fell 0.9 percentage points compared with the previous month and were only 0.04 percentage points higher than one year ago. Flat mortgage rates are a welcome change for home buyers following 2018 and the 2.8 percent year-over-year growth in household income helped boost affordability. The result? House-buying power increased 2.4 percent in February compared with one year ago, and 1 percent compared with last month.
Additionally, while unadjusted house price appreciation in February persisted, the pace of appreciation slowed to 5.4 percent, compared with the 7.1 percent year-over-year growth in February 2018. As a result, real house price appreciation fell to 2.9 percent, the slowest year-over-year pace since December 2017.
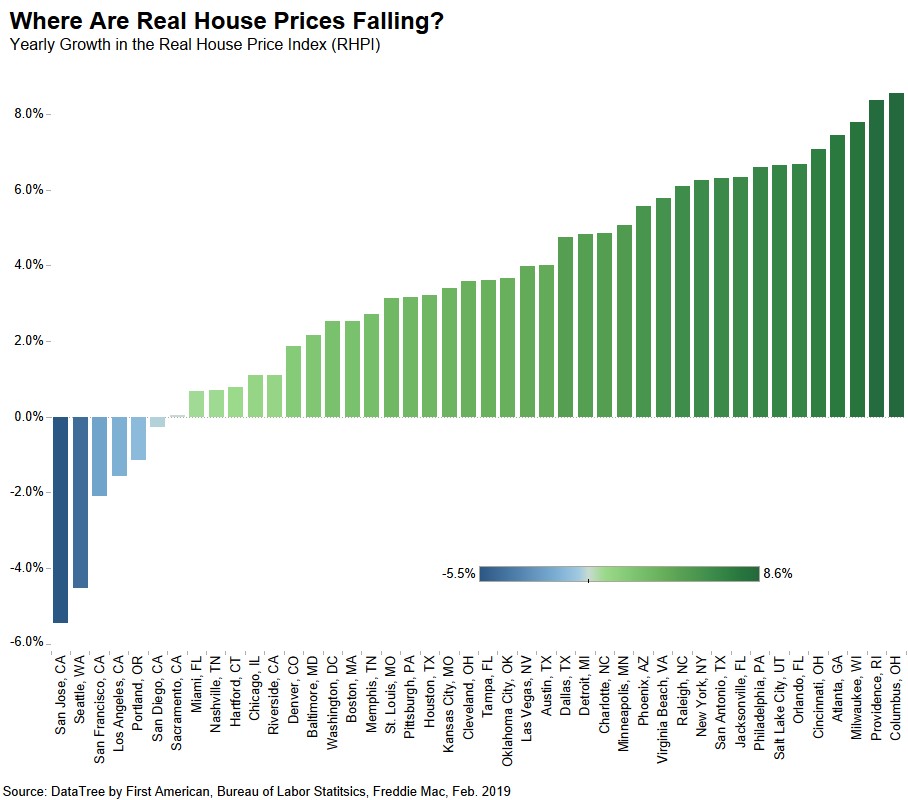
Six Cities Where Affordability Increased
While we know that rising household income and a decline in mortgage rates caused real house price appreciation to slow nationally, real house prices declined in a few markets. Compared with a year ago, six cities saw year-over-year declines in the RHPI, signaling an improvement in affordability:
- San Jose, Calif. (-5.5 percent)
- Seattle (-4.5 percent)
- San Francisco (-2.1 percent)
- Los Angeles (-1.6 percent)
- Portland, Ore. (-1.1 percent)
- San Diego (-0.3 percent)
Supply Surge
These coastal markets all have something in common: they were the tightest and hottest markets of 2018. In the first half of 2018, rising millennial demand amid a backdrop of limited inventory and increasing mortgage rates put pressure on affordability, causing buyers to take a step back. But now, affordability is on the rise and the main reason is rising inventory.
According to First American calculations of Realtor.com February 2019 data, the number of listings in San Jose, Seattle and San Francisco increased 124 percent, 89 percent and 52 percent respectively compared with one year ago. As inventory enters the market, buyers have more options, bidding wars are less likely, and sellers are more likely to reduce list prices. In fact, these three markets experienced the greatest yearly growth in the number of listings with price reductions.
Softening Sellers’ Markets
These six markets may signal a broader shift in the housing market. Across the nation, home buyers are benefiting from lower-than-anticipated mortgage rates, rising wages and a slowdown in unadjusted house price appreciation. Only the six markets above showed a year-over year decline in the RHPI, but 37 out the 44 top markets that we track showed month-over-month declines in the RHPI in February.
However, while these trends help home buyers, it’s too soon to call it a buyers’ market. Unadjusted house prices are still rising and it’s clear that demand continues to outstrip supply in most markets. Data on the movement of unadjusted house prices during the early spring home-buying season won’t be available for a few more months, but it’s quite likely that price appreciation will accelerate again.
The RHPI is updated monthly with new data. Look for the next edition of the RHPI the week of May 27, 2019.
Sources:
February 2019 Real House Price Index Highlights
The First American Real House Price Index (RHPI) showed that in February 2019:
- Real house prices decreased 0.4 percent between January 2019 and February 2019.
- Real house prices increased 2.9 percent year over year.
- Consumer house-buying power, how much one can buy based on changes in income and interest rates, increased 1.0 percent between January 2019 and February 2019, and increased 2.4 percent year over year.
- Average household income has increased 2.8 percent since February 2018 and 55.0 percent since January 2000.
- Real house prices are 14.0 percent less expensive than in January 2000.
- While unadjusted house prices are now 2.3 percent above the housing boom peak in 2006, real, house-buying power-adjusted house prices remain 39.0 percent below their 2006 housing boom peak.
February 2019 Real House Price State Highlights
- The five states with the greatest year-over-year increase in the RHPI are: New Hampshire (+8.1 percent), Wisconsin (+7.8 percent), Rhode Island (+6.5 percent), Ohio (+6.0 percent), and Georgia (+6.0 percent).
- The five states with the greatest year-over-year decrease in the RHPI are: Wyoming (-6.2 percent), Louisiana (-2.4 percent), Alabama (-2.0), Oklahoma (-1.5 percent), and North Dakota (-1.5 percent).
February 2019 Real House Price Local Market Highlights
- Among the Core Based Statistical Areas (CBSAs) tracked by First American, the five markets with the greatest year-over-year increase in the RHPI are: Columbus, Ohio (+8.6 percent), Providence, R.I. (+8.4 percent), Milwaukee (+7.8 percent), Atlanta (+7.4 percent), and Cincinnati (+7.1 percent).
- Among the Core Based Statistical Areas (CBSAs) tracked by First American, the five markets with the greatest year-over-year decrease in the RHPI are: San Jose, Calif. (-5.5 percent), Seattle (-4.5 percent), San Francisco (-2.1 percent), Los Angeles (-1.6 percent), Portland, Ore. (-1.1 percent).
Deputy Chief Economist Odeta Kushi contributed to this post.


