As 2019 came to a close, potential home buyers received a year-end gift as affordability improved relative to one year ago. Two of the three key drivers of the Real House Price Index (RHPI), household income and mortgage rates, swung in favor of increased affordability in December.
“While low mortgage rates and higher income boost affordability and demand for homes, it’s hard to buy what’s not for sale. That means sellers’ market conditions are likely to persist in 2020, as short supply and strong demand will drive faster price appreciation.”
The Bureau of Labor Statistics reported that average hourly earnings increased in December 2019 by 3.2 percent compared with a year ago. Wage growth results in higher household income, which means home buyers can borrow more. Compared with December 2018, household income increased by 2.2 percent, and the 30-year, fixed-rate mortgage fell by 0.9 percentage points. So, consumer house-buying power – how much one can buy based on changes in income and interest rates – continued to grow in December, which helps encourage demand.
Regional Household Income Differences Shape Housing Affordability
Declining mortgage rates increase affordability equally in each market, as mortgage rates are generally similar across the country. However, household income varies substantially by housing market, so comparing house-buying power with median sales price by market can provide perspective on housing affordability.
In the figure below, home buyers in markets below the line benefit from house-buying power that is greater than the median house price in their market – houses are relatively more affordable in these markets. Home buyers in markets above the line are less fortunate, as house-buying power is less than the median house price in these markets – houses are relatively less affordable in these markets.
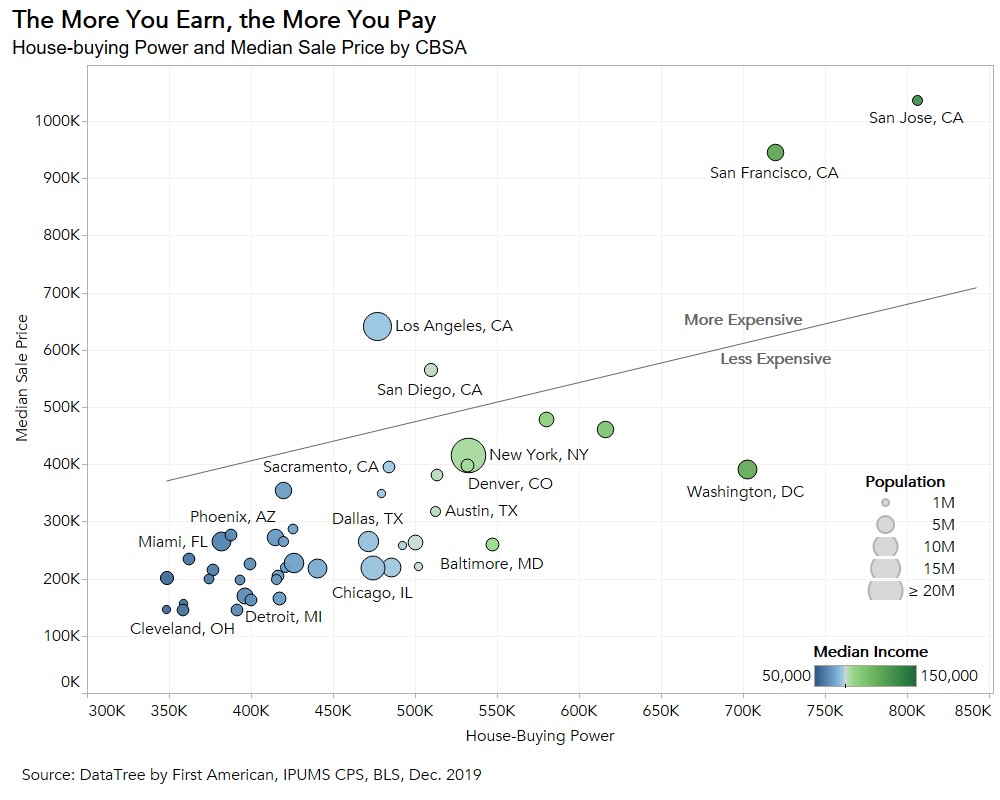
Surprisingly, median house prices exceed house-buying power in only four markets, and they’re all coastal cities in California. Of the 44 markets we track, these four markets also have the highest nominal home prices. Yet, other housing markets also considered expensive, like Seattle, Washington, D.C., Boston and Denver, are more affordable than many believe. The list below shows the top 10 most expensive markets, measured by median sale price of a home in December 2019. Examining the list, it’s clear that the strength of median incomes in these markets helps boost house-buying power above the median house price, helping affordability.
| City | House-Buying Power | Median Sale Price (3-month moving average) |
Median Income |
|---|---|---|---|
| San Jose, CA | $806,600 | $1,036,500 | $128,570 |
| San Francisco, CA | $719,979 | $945,547 | $114,763 |
| Los Angeles, CA | $476,963 | $641,316 | $76,027 |
| San Diego, CA | $509,882 | $564,813 | $81,274 |
| Seattle, WA | $580,022 | $478,486 | $92,454 |
| Boston, MA | $616,345 | $459,812 | $98,244 |
| New York, NY | $532,474 | $415,363 | $84,875 |
| Denver, CO | $532,161 | $398,500 | $84,825 |
| Sacramento, CA | $484,041 | $394,250 | $77,155 |
| Washington, DC | $702,608 | $391,124 | $111,994 |
Sellers’ Market Conditions, Faster Price Appreciation Ahead
House-buying power exceeds median house price in most of the markets we monitor in our RHPI. However, while low mortgage rates and higher income boost affordability and demand for homes, it’s hard to buy what’s not for sale. That means sellers’ market conditions are likely to persist in 2020, as short supply and strong demand will drive faster price appreciation and reduce the current levels of affordability in many markets. The question is, can house-buying power growth can keep up.
For more analysis of affordability, please visit the Real House Price Index.
The RHPI is updated monthly with new data. Look for the next edition of the RHPI the week of March 30, 2020.
Sources:
December 2019 Real House Price Index Highlights
The First American Real House Price Index (RHPI) showed that in December 2019:
- Real house prices increased 1.4 percent between November 2019 and December 2019.
- Real house prices declined 5.8 percent between December 2018 and December 2019.
- Consumer house-buying power, how much one can buy based on changes in income and interest rates, decreased 0.2 percent between November 2019 and December 2019, and increased 14.0 percent year over year.
- Median household income has increased 2.2 percent since December 2018 and 58.5 percent since January 2000.
- Real house prices are 17.3 percent less expensive than in January 2000.
- While unadjusted house prices are now 9.3 percent above the housing boom peak in 2006, real, house-buying power-adjusted house prices remain 41.1 percent below their 2006 housing boom peak.
December 2019 Real House Price State Highlights
- There are no states with a year-over-year increase in the RHPI.
- The five states with the greatest year-over-year decrease in the RHPI are:
- New Mexico (-9.9 percent)
- Utah (-9.1 percent)
- North Dakota (-9.0 percent)
- Nebraska (-8.7 percent)
- California (-8.6 percent)
December 2019 Real House Price Local Market Highlights
- Among the Core Based Statistical Areas (CBSAs) tracked by First American, the only market with a year-over-year increase in the RHPI is:
- Cleveland (+0.5 percent)
- Among the Core Based Statistical Areas (CBSAs) tracked by First American, the five markets with the greatest year-over-year decrease in the RHPI are:
- San Jose, Calif. (-11.2 percent)
- Baltimore (-10.5 percent)
- Riverside, Calif (-10.2 percent)
- San Francisco (-9.3 percent)
- Portland, Ore. (-9.2 percent)
About the First American Real House Price Index
The traditional perspective on house prices is fixated on the actual prices and the changes in those prices, which overlooks what matters to potential buyers - their purchasing power, or how much they can afford to buy. First American’s proprietary Real House Price Index (RHPI) adjusts prices for purchasing power by considering how income levels and interest rates influence the amount one can borrow.
The RHPI uses a weighted repeat-sales house price index that measures the price movements of single-family residential properties by time and across geographies, adjusted for the influence of income and interest rate changes on consumer house-buying power. The index is set to equal 100 in January 2000. Changing incomes and interest rates either increase or decrease consumer house-buying power. When incomes rise and mortgage rates fall, consumer house-buying power increases, acting as a deflator of increases in the house price level. For example, if the house price index increases by three percent, but the combination of rising incomes and falling mortgage rates increase consumer buying power over the same period by two percent, then the Real House Price index only increases by 1 percent. The Real House Price Index reflects changes in house prices, but also accounts for changes in consumer house-buying power.
Disclaimer
Opinions, estimates, forecasts and other views contained in this page are those of First American’s Chief Economist, do not necessarily represent the views of First American or its management, should not be construed as indicating First American’s business prospects or expected results, and are subject to change without notice. Although the First American Economics team attempts to provide reliable, useful information, it does not guarantee that the information is accurate, current or suitable for any particular purpose. © 2020 by First American. Information from this page may be used with proper attribution.


