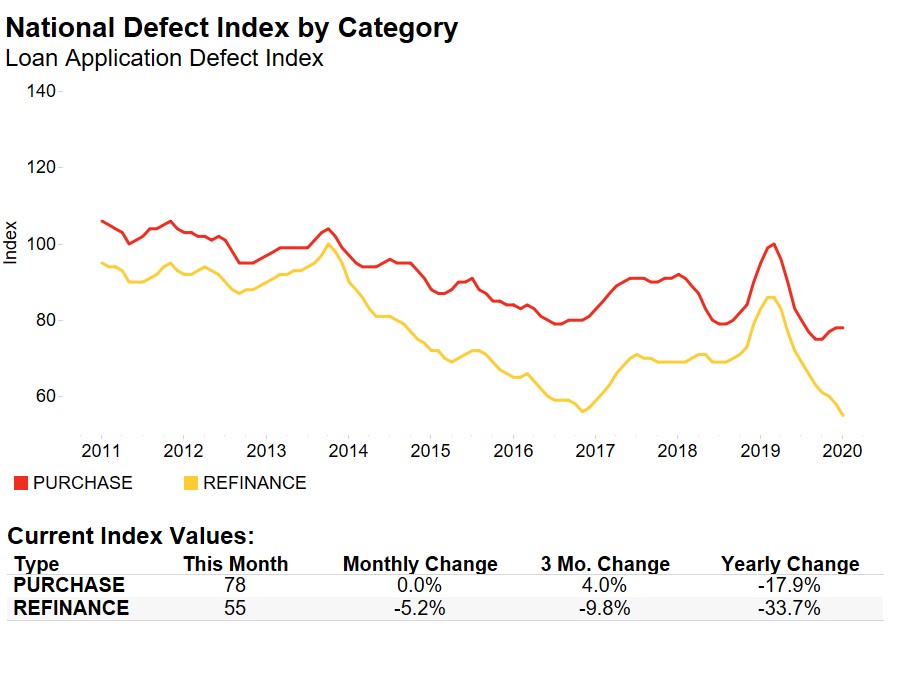
Last month, we predicted that if mortgage rates continued to fall, it may help ease the pressure on fraud risk. Indeed, the 30-year, fixed-rate mortgage fell to its lowest level since January 2018, and fraud risk has fallen alongside it. The Loan Application Defect Index for purchase transactions declined 6.3 percent in May compared with April, the second consecutive month that defect risk in purchase transactions declined. Overall, the frequency of defects, fraudulence and misrepresentation in the information submitted in mortgage loan applications also declined 5.5 percent compared with last month.
"As potential home buyers feel the relief of the 2018 sellers’ market conditions, we expect fraud risk to continue to decline."
Market Dynamics Shift Toward Buyers and Less Fraud Risk
Following the strong sellers’ market conditions throughout 2018, market dynamics have shifted slightly toward buyers in 2019. Mortgage rates began to decline in January 2019 and are now lower than one year ago. Meanwhile, household income, the other component of house-buying power, has continued to increase, rising 2.8 percent in May compared with one year ago. Falling mortgage rates and rising household income have boosted consumer house-buying power.
On the supply side, while inventory remains tight, there has been some progress. In May, inventories increased 2.7 percent nationally compared with one year ago. The trend is similar at the market level as active inventory increased in 40 of the top 50 metropolitan areas.
House-buying power gains and improvements in inventory tilt the market toward the buyer. But, what is the connection to fraud risk? Potential home buyers feel less pressure to misrepresent information on a loan application when strong sellers’ market conditions wane.
Fraud Risk is Local Too
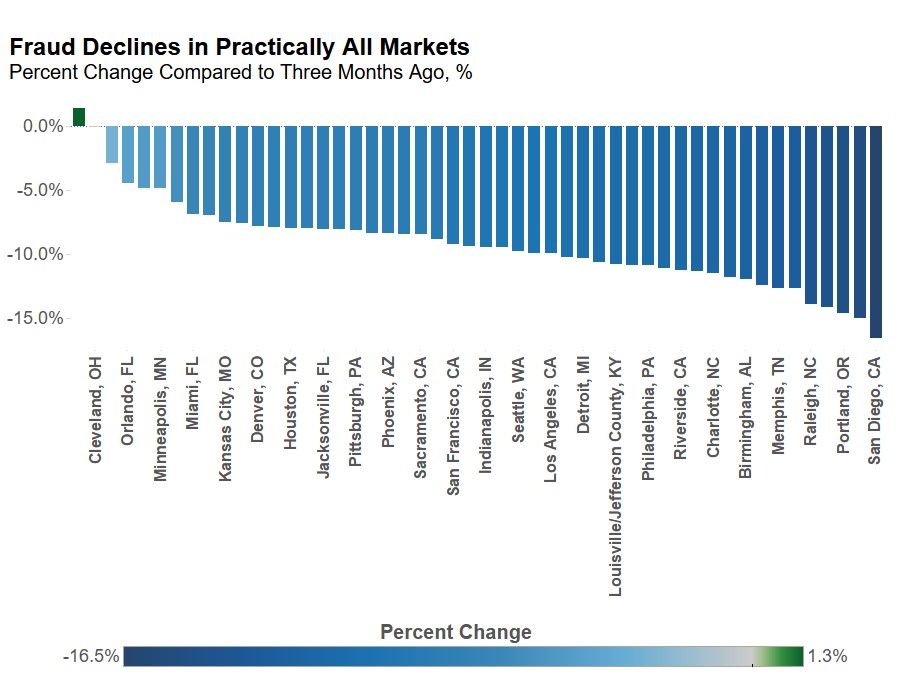
The real estate adage, “location, location, location” applies to the world of mortgage fraud risk as well. Some markets are hotter than others, prompting differences in fraud risk. The Defect Index measures loan application misrepresentation, defect and fraud risk over time in 50 of the largest markets in the U.S. When analyzing local market-level data, comparing data at three-month intervals tends to be more helpful in identifying trends than data from more volatile month-to-month comparisons. Nationally, the Defect Index declined 9.5 percent in May compared with three months ago and defect risk declined in all but one market – Columbus, Ohio. Indeed, in some markets, the decline was substantial, exceeding 10 percent in 20 markets. According to our April 2019 Real House Price Index (RHPI), affordability improved in most of the markets where fraud risk declined compared with three months ago, allowing potential home buyers to feel more secure in their purchase and reducing fraud risk.
As potential home buyers feel the relief of the 2018 sellers’ market conditions, we expect fraud risk to continue to decline. The healthy labor market has resulted in strong income growth and falling mortgage rates contributed to house-buying power gains, prompting both income and employment fraud risk to fall over the past two months.
However, with more house-buying power comes more demand for homes, which escalates prices. April data already indicated a faster pace of house price appreciation. If house prices continue to rise, housing affordability will take a hit, which may send fraud risk higher again.
For Mark’s full analysis on loan defect risk, please visit the Loan Application Defect Index.
The Defect Index is updated monthly with new data. Look for the next edition of the Defect Index the week of July 29, 2019.
May 2019 Loan Application Defect Index
The First American Loan Application Defect Index showed that in May 2019:
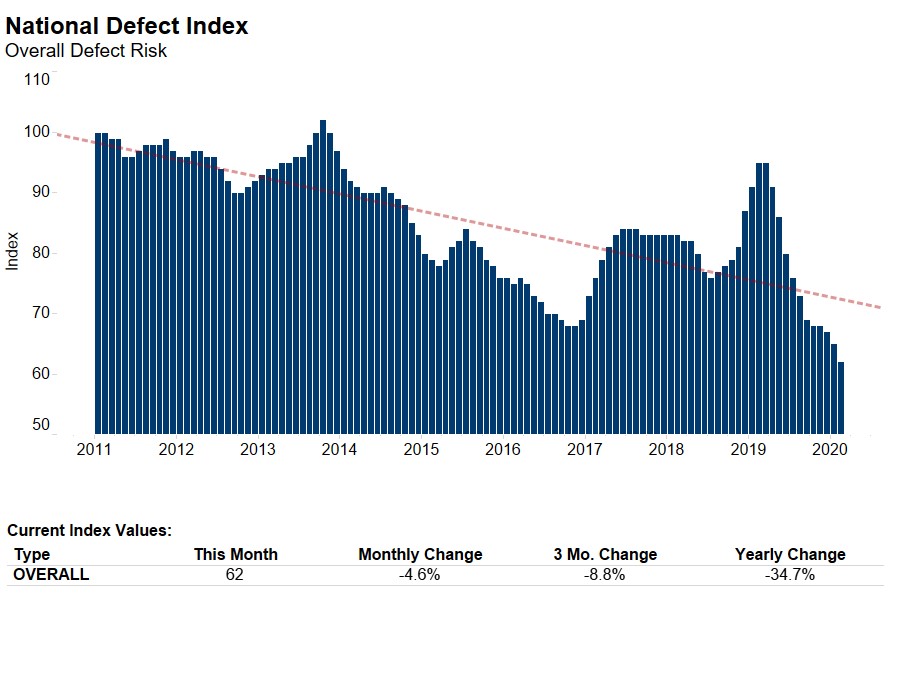
- The frequency of defects, fraudulence and misrepresentation in the information submitted in mortgage loan applications decreased by 5.5 percent compared with the previous month.
- Compared to May 2018, the Defect Index increased by 7.5 percent.
- The Defect Index is down 15.7 percent from the high point of risk in October 2013.
- The Defect Index for refinance transactions decreased by 7.2 percent compared with previous month, and is up 8.5 percent compared with a year ago.
- The Defect Index for purchase transactions decreased by 6.3 percent compared with the previous month, and is up 8.4 percent compared with a year ago.
May 2019 State Highlights
- The five states with a year-over-year increase in defect frequency are: Nebraska (+39.1 percent), Hawaii (+30.1 percent), Iowa (+29.9 percent), New York (+27.6 percent), and Pennsylvania (+23.4 percent).
- The five states with a year-over-year decrease in defect frequency are: Arkansas (-9.7 percent), Vermont (-4.8 percent), Florida (-3.3 percent), Utah (-2.3 percent), and Arizona (-1.3 percent).
May 2019 Local Market Highlights
- Among the largest 50 Core Based Statistical Areas (CBSAs), the five markets with the greatest year-over-year increase in defect frequency are: Pittsburgh (+31.7 percent), Buffalo, N.Y. (+30.2 percent), New Orleans (+24.7 percent), Cincinnati (+20.5 percent), and New York (+19.0 percent).
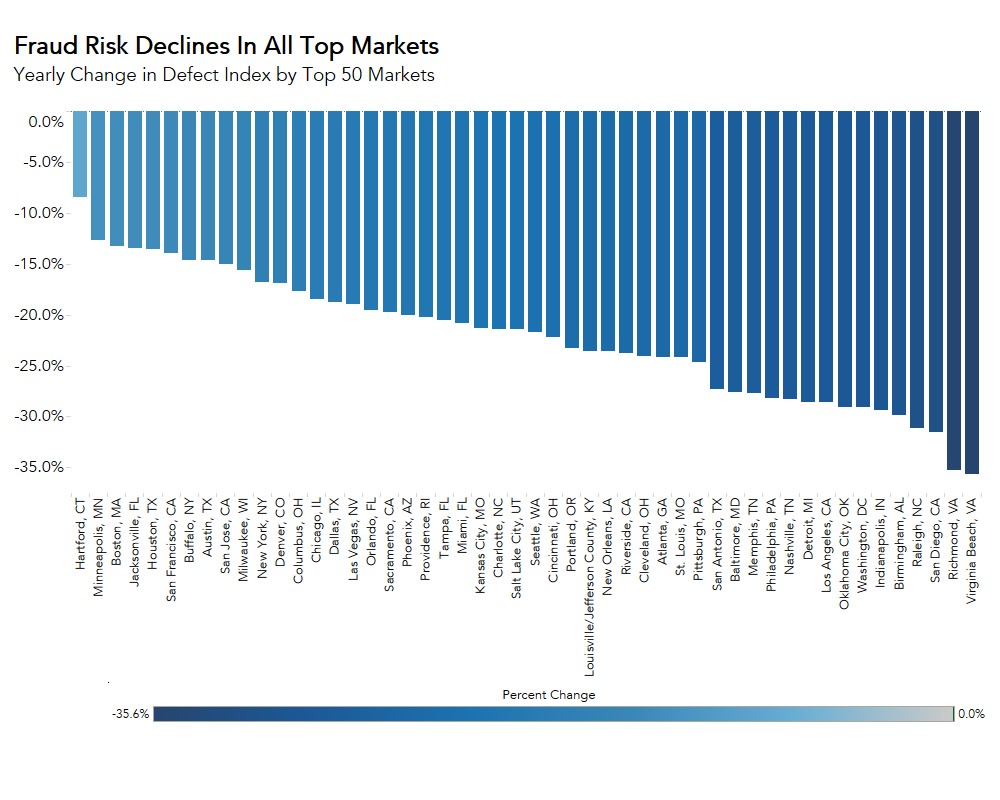
- Among the largest 50 Core Based Statistical Areas (CBSAs), the five markets with year-over-year decrease in defect frequency are: Jacksonville, Fla. (-13.0 percent), Houston (-12.0 percent), San Diego (-9.0 percent), Orlando, Fla. (-8.6 percent), and Los Angeles (-4.2 percent).
Methodology
The First American Loan Application Defect Index estimates the level of defects detected in the information submitted in mortgage loan applications processed by the First American FraudGuard® system. The index is based on the frequency with which defect indicators are identified. The Defect Index moves higher as greater numbers of defect indicators are identified. An increase in the index indicates a rising level of loan application defects. The index, nationally and in all markets, is benchmarked to a value of 100 in January 2011. Therefore, all index values can be interpreted as the percentage change in defect frequency relative to the defect frequency identified nationally in January 2011.