Affordability improved in October as two of the three key drivers of the Real House Price Index (RHPI), household income and mortgage rates, modestly swung in favor of increased affordability relative to one year ago. The 30-year, fixed-rate mortgage fell by 1.1 percentage points and household income increased 2.6 percent compared with October 2018. Rising household income and declining mortgage rates each boost consumer house-buying power.
“While rising house-buying power, largely driven by declining mortgage rates, made monthly mortgage payments more manageable in 2019, any further increases in house-buying power will likely rest on the labor market and continued household income growth in 2020.”
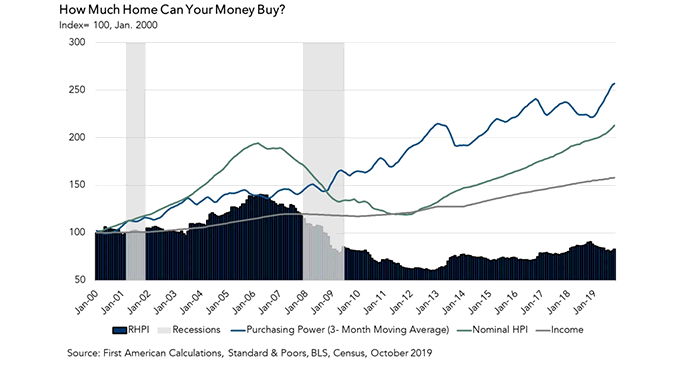
While home buyers benefitted from the increase in house-buying power driven by lower rates and household income growth, they also face greater competition for homes as increased house-buying power has also fueled greater demand. As demand increases for a scarce (limited or low supply) good, prices will rise faster. The housing market saw this dynamic play out in October as nominal house price appreciation accelerated relative to a year ago. However, even as nominal house prices have gained momentum because of the supply and demand imbalance, real house prices (RHPI) actually declined by 7.9 percent thanks to the benefit of increased buying power. The increase in house-buying power was more than sufficient to offset nominal house price gains. In order to understand these dynamics, let’s break down the three forces driving the RHPI, and what they signal for 2020.
Rising Income + Low Mortgage Rates = Faster House Price Appreciation
- Income on the Rise: The labor market impressed again in October as annual hourly wage growth increased by 3.2 percent compared with a year earlier, job growth remained steady, and the unemployment rate fell to 3.5 percent, a 50-year low. The rise in wage growth contributed to a 2.6 percent year-over-year increase in average household income. Compared with October 2018, the rise in household income increased consumer house-buying power by $9,300. The outlook for the labor market remains strong, especially given that job creation continues, and wages are still rising.
- Rate Drop: While mortgage rates increased modestly in October compared with one month ago, they are still significantly lower than they were a year ago. The decline in mortgage rates from 4.8 percent last October to 3.7 percent this October boosted house-buying power by an impressive $51,800. Combined with the gains from household income, overall house-buying power improved by more than $61,000 compared with October 2018. Looking ahead to 2020, mortgage rates are expected to remain relatively flat, but stay below 4 percent. If that is the case, then any further improvement in house-buying power will be driven by household income gains and the health of the labor market in 2020.
- Nominal House Prices Rise: Economics 101 teaches us that in a market with strong demand and limited supply, we can expect faster house price appreciation. Since the beginning of the spring home-buying season in April 2019, house price appreciation has accelerated. Yet, rising house-buying power has outpaced the rise in nominal house price appreciation, for now.
More Millennial Buyers on the Way in 2020
The bulk of the millennial generation, America’s largest generation, will turn 30 next year, entering their prime home-buying years. This generation of buyers grew up in an era of sub-4 percent mortgage rates and also have higher household incomes than their predecessors. Financial readiness combined with a heightened appetite for homeownership will power continued demand for homes in 2020. Yet, there is not enough supply to meet the growing demand, so we expect faster house price appreciation, a dynamic we’re already experiencing in the housing market today. While rising house-buying power, largely driven by declining mortgage rates, made monthly mortgage payments more manageable in 2019, any further increases in house-buying power will likely rest on the labor market and continued household income growth in 2020.
For more analysis of affordability, please visit the Real House Price Index.
The RHPI is updated monthly with new data. Look for the next edition of the RHPI the week of January 27, 2020.
Sources:
October 2019 Real House Price Index Highlights
The First American Real House Price Index (RHPI) showed that in October 2019:
- Real house prices increased 2.0 percent between September 2019 and October 2019.
- Real house prices declined 7.9 percent between October 2018 and October 2019.
- Consumer house-buying power, how much one can buy based on changes in income and interest rates, decreased 0.7 percent between September 2019 and October 2019, and increased 17.6 percent year over year.
- Median household income has increased 2.6 percent since October 2018 and 58.2 percent since January 2000.
- Real house prices are 17.2 percent less expensive than in January 2000.
- While unadjusted house prices are now 9.6 percent above the housing boom peak in 2006, real, house-buying power-adjusted house prices remain 41.0 percent below their 2006 housing boom peak.
October Real House Price State Highlights
- There are no states with a year-over-year increase in the RHPI.
- The five states with the greatest year-over-year decrease in the RHPI are:
- New Mexico (-13.4 percent)
- Vermont (-12.2 percent)
- California (-12.1 percent)
- Nebraska (-11.4 percent)
- Utah (-11.3 percent)
October 2019 Real House Price Local Market Highlights
- Among the Core Based Statistical Areas (CBSAs) tracked by First American, there are no markets with a year-over-year increase in the RHPI.
- Among the Core Based Statistical Areas (CBSAs) tracked by First American, the five markets with the greatest year-over-year decrease in the RHPI are:
- San Jose, Calif. (-16.2 percent)
- San Francisco (-13.1 percent)
- Portland, Ore. (-12.6 percent)
- Baltimore (-12.0 percent)
- Denver (-11.8 percent).
About the First American Real House Price Index
The traditional perspective on house prices is fixated on the actual prices and the changes in those prices, which overlooks what matters to potential buyers - their purchasing power, or how much they can afford to buy. First American’s proprietary Real House Price Index (RHPI) adjusts prices for purchasing power by considering how income levels and interest rates influence the amount one can borrow.
The RHPI uses a weighted repeat-sales house price index that measures the price movements of single-family residential properties by time and across geographies, adjusted for the influence of income and interest rate changes on consumer house-buying power. The index is set to equal 100 in January 2000. Changing incomes and interest rates either increase or decrease consumer house-buying power. When incomes rise and mortgage rates fall, consumer house-buying power increases, acting as a deflator of increases in the house price level. For example, if the house price index increases by three percent, but the combination of rising incomes and falling mortgage rates increase consumer buying power over the same period by two percent, then the Real House Price index only increases by 1 percent. The Real House Price Index reflects changes in house prices, but also accounts for changes in consumer house-buying power.
Disclaimer
Opinions, estimates, forecasts and other views contained in this page are those of First American’s Chief Economist, do not necessarily represent the views of First American or its management, should not be construed as indicating First American’s business prospects or expected results, and are subject to change without notice. Although the First American Economics team attempts to provide reliable, useful information, it does not guarantee that the information is accurate, current or suitable for any particular purpose. © 2019 by First American. Information from this page may be used with proper attribution.


